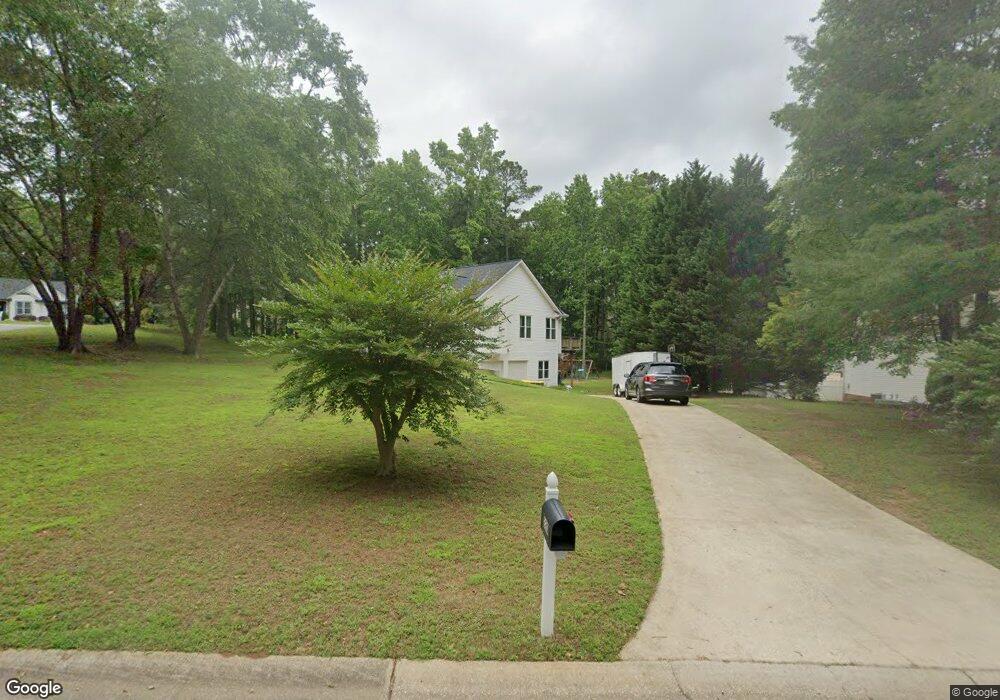
220 N Strathmore Dr Sharpsburg, GA 30277
Estimated Value: $372,000 - $452,000
4
Beds
2
Baths
1,772
Sq Ft
$230/Sq Ft
Est. Value
About This Home
This home is located at 220 N Strathmore Dr, Sharpsburg, GA 30277 and is currently estimated at $408,333, approximately $230 per square foot. 220 N Strathmore Dr is a home located in Coweta County with nearby schools including Canongate Elementary School, Madras Middle School, and Northgate High School.
Ownership History
Date
Name
Owned For
Owner Type
Purchase Details
Closed on
Apr 27, 2022
Sold by
Mitcham Sherold Lee
Bought by
Mcelroy Kyle Robert
Current Estimated Value
Home Financials for this Owner
Home Financials are based on the most recent Mortgage that was taken out on this home.
Original Mortgage
$244,000
Outstanding Balance
$228,582
Interest Rate
4.16%
Mortgage Type
New Conventional
Estimated Equity
$179,751
Purchase Details
Closed on
Feb 11, 1998
Sold by
Bob Adams Homes
Bought by
Mitcham Sherold L and Mitcham Joy N
Home Financials for this Owner
Home Financials are based on the most recent Mortgage that was taken out on this home.
Original Mortgage
$149,000
Interest Rate
7.07%
Mortgage Type
New Conventional
Purchase Details
Closed on
Jul 7, 1997
Bought by
Bob Adams Homes Inc
Purchase Details
Closed on
Jun 7, 1995
Bought by
Rockport Inc
Purchase Details
Closed on
Mar 31, 1986
Bought by
Cannon Gate Associat
Create a Home Valuation Report for This Property
The Home Valuation Report is an in-depth analysis detailing your home's value as well as a comparison with similar homes in the area
Home Values in the Area
Average Home Value in this Area
Purchase History
| Date | Buyer | Sale Price | Title Company |
|---|---|---|---|
| Mcelroy Kyle Robert | $305,000 | -- | |
| Mitcham Sherold L | $177,400 | -- | |
| Mitcham Sherold Lee | $177,300 | -- | |
| Bob Adams Homes Inc | $23,000 | -- | |
| Rockport Inc | $341,100 | -- | |
| Cannon Gate Associat | -- | -- |
Source: Public Records
Mortgage History
| Date | Status | Borrower | Loan Amount |
|---|---|---|---|
| Open | Mcelroy Kyle Robert | $244,000 | |
| Previous Owner | Mitcham Sherold Lee | $149,000 |
Source: Public Records
Tax History Compared to Growth
Tax History
| Year | Tax Paid | Tax Assessment Tax Assessment Total Assessment is a certain percentage of the fair market value that is determined by local assessors to be the total taxable value of land and additions on the property. | Land | Improvement |
|---|---|---|---|---|
| 2025 | $3,728 | $157,798 | $30,000 | $127,798 |
| 2024 | $3,719 | $160,208 | $30,000 | $130,208 |
| 2023 | $3,719 | $139,357 | $22,000 | $117,357 |
| 2022 | $1,319 | $131,630 | $22,000 | $109,630 |
| 2021 | $933 | $111,278 | $22,000 | $89,278 |
| 2020 | $933 | $111,278 | $22,000 | $89,278 |
| 2019 | $1,392 | $101,894 | $12,000 | $89,894 |
| 2018 | $1,397 | $101,894 | $12,000 | $89,894 |
| 2017 | $1,561 | $94,816 | $12,000 | $82,816 |
| 2016 | $1,531 | $94,816 | $12,000 | $82,816 |
| 2015 | $1,244 | $86,322 | $12,000 | $74,322 |
| 2014 | $1,535 | $84,322 | $10,000 | $74,322 |
Source: Public Records
Map
Nearby Homes
- 20 Skipton Ct
- 10 Monteray Ct
- 70 N Strathmore Dr
- 40 Wenham Ln
- 259 Strathmore Dr Unit 3
- 9 Warrior Way
- 12 Race Point Way
- 131 Cannongate Cir
- 11 Line Creek Cir
- 125 Cannongate Cir
- 46 I W Brooks Rd
- 127 Northgate Preserve Dr
- 319 Beaconsfield Dr
- 95 Tyler Woods Dr
- 104 Ashland Trail
- 100 Ashland Trail
- 972 Raymond Hill Rd
- 121 Northwoods Rd
- 25 Sycamore Way
- 306 Northgate Preserve Dr
- 0 Sedgewick Ct Unit 8179419
- 230 N Strathmore Dr Unit 11
- 15 Sedgewick Ct
- 10 Sedgewick Ct Unit 7
- 50 Evonshire Dr
- 65 Parkford Ct Unit 8
- 20 Sedgewick Ct
- 55 Parkford Ct Unit 8
- 180 N Strathmore Dr
- 45 Evonshire Dr
- 45 Parkford Ct
- 195 N Strathmore Dr
- 75 Parkford Ct Unit 8
- 35 Parkford Ct Unit 8
- 40 Evonshire Dr Unit 7
- 185 N Strathmore Dr Unit 7
- 164 N Strathmore Dr Unit 7
- 35 Evonshire Dr Unit 7
- 70 Parkford Ct
- 60 Parkford Ct Unit 8