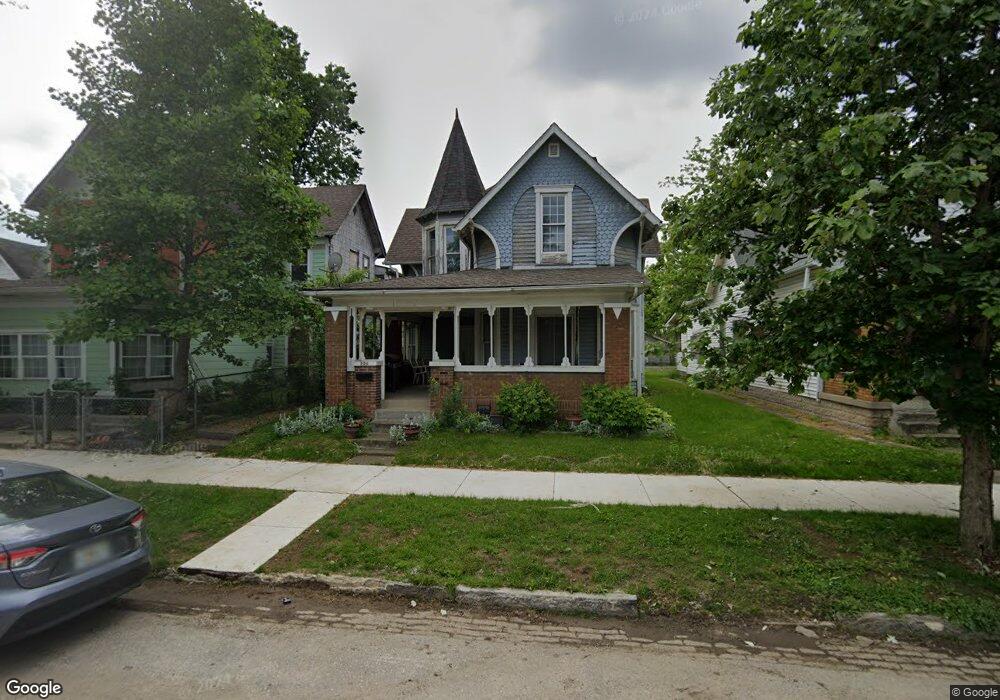
220 N Temple Ave Indianapolis, IN 46201
Near Eastside NeighborhoodEstimated Value: $206,414 - $284,000
4
Beds
2
Baths
1,990
Sq Ft
$124/Sq Ft
Est. Value
About This Home
This home is located at 220 N Temple Ave, Indianapolis, IN 46201 and is currently estimated at $245,854, approximately $123 per square foot. 220 N Temple Ave is a home located in Marion County with nearby schools including Thomas D. Gregg School No. 15, Washington Irving School 14, and Anna Brochhausen School 88.
Ownership History
Date
Name
Owned For
Owner Type
Purchase Details
Closed on
Sep 12, 2014
Sold by
Marion County Board Of Commissioners
Bought by
Siles Rolando
Current Estimated Value
Purchase Details
Closed on
Sep 11, 2014
Sold by
Ediba Llc
Bought by
Marion County
Purchase Details
Closed on
Dec 18, 2013
Sold by
Isaacson Doreen J
Bought by
Isaacson Doreen J and The Doreen J Isaacson Living T
Purchase Details
Closed on
Feb 15, 2010
Sold by
Villasol Miguel
Bought by
Ediba Llc
Purchase Details
Closed on
Jun 22, 2005
Sold by
Integtrated Residentail Sercvices Inc
Bought by
Vilasol Miguel
Purchase Details
Closed on
Jun 6, 2005
Sold by
Integtrated Residentail Sercvices Inc
Bought by
Vilasol Miguel
Purchase Details
Closed on
Jan 16, 2005
Sold by
Baker Bruno S and Baker Brenda M
Bought by
Intergrated Residential Services Inc
Create a Home Valuation Report for This Property
The Home Valuation Report is an in-depth analysis detailing your home's value as well as a comparison with similar homes in the area
Home Values in the Area
Average Home Value in this Area
Purchase History
| Date | Buyer | Sale Price | Title Company |
|---|---|---|---|
| Siles Rolando | $5,200 | None Available | |
| Marion County | $2,598 | None Available | |
| Isaacson Doreen J | -- | None Available | |
| Ediba Llc | -- | None Available | |
| Vilasol Miguel | -- | None Available | |
| Vilasol Miguel | -- | None Available | |
| Intergrated Residential Services Inc | -- | None Available |
Source: Public Records
Tax History Compared to Growth
Tax History
| Year | Tax Paid | Tax Assessment Tax Assessment Total Assessment is a certain percentage of the fair market value that is determined by local assessors to be the total taxable value of land and additions on the property. | Land | Improvement |
|---|---|---|---|---|
| 2024 | $1,771 | $156,000 | $6,300 | $149,700 |
| 2023 | $1,771 | $151,200 | $6,300 | $144,900 |
| 2022 | $1,729 | $141,600 | $6,300 | $135,300 |
| 2021 | $1,215 | $104,800 | $6,300 | $98,500 |
| 2020 | $534 | $70,900 | $2,400 | $68,500 |
| 2019 | $338 | $44,200 | $2,400 | $41,800 |
| 2018 | $346 | $39,900 | $2,400 | $37,500 |
| 2017 | $297 | $38,300 | $2,400 | $35,900 |
| 2016 | $267 | $34,700 | $2,400 | $32,300 |
| 2014 | $545 | $33,500 | $2,400 | $31,100 |
| 2013 | $545 | $26,200 | $2,400 | $23,800 |
Source: Public Records
Map
Nearby Homes
- 251 N Temple Ave
- 249 N Temple Ave
- 2605 E New York St
- 2607 E New York St
- 2609 E New York St
- 2613 E New York St
- 2611 E New York St
- 238 N Tacoma Ave
- 228 N Tacoma Ave
- 318 N Tacoma Ave
- 224 N Tacoma Ave
- 406 N Temple Ave
- 218 N Rural St
- 423 N Tacoma Ave
- 418 Eastern Ave
- 237 N Keystone Ave
- 420 Eastern Ave
- 430 Eastern Ave
- 412 N Rural St
- 21 N Tacoma Ave
- 224 N Temple Ave
- 218 N Temple Ave
- 228 N Temple Ave
- 214 N Temple Ave
- 232 N Temple Ave
- 208 N Temple Ave
- 219 N Tacoma Ave
- 225 N Tacoma Ave
- 225 N Temple Ave
- 217 N Tacoma Ave
- 229 N Tacoma Ave
- 215 N Tacoma Ave
- 204 N Temple Ave
- 236 N Temple Ave
- 235 N Tacoma Ave
- 209 N Tacoma Ave
- 202 N Temple Ave
- 237 N Tacoma Ave
- 205 N Tacoma Ave
- 209 N Temple Ave