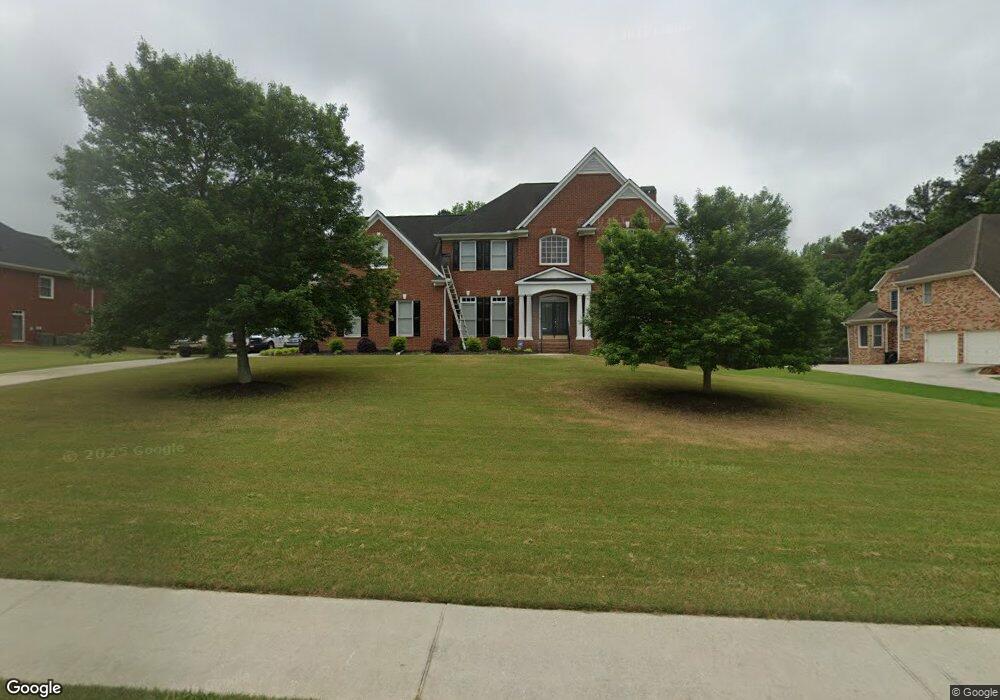
220 Newfield Dr Tyrone, GA 30290
Estimated Value: $565,000 - $674,000
4
Beds
4
Baths
3,448
Sq Ft
$178/Sq Ft
Est. Value
About This Home
This home is located at 220 Newfield Dr, Tyrone, GA 30290 and is currently estimated at $612,663, approximately $177 per square foot. 220 Newfield Dr is a home located in Fayette County with nearby schools including Crabapple Lane Elementary School, Flat Rock Middle School, and Sandy Creek High School.
Ownership History
Date
Name
Owned For
Owner Type
Purchase Details
Closed on
May 5, 2011
Sold by
Federal Home Loan Mortgage Corporation
Bought by
Jones Valencia Y and Jones Roderick G
Current Estimated Value
Home Financials for this Owner
Home Financials are based on the most recent Mortgage that was taken out on this home.
Original Mortgage
$229,042
Outstanding Balance
$155,352
Interest Rate
4.75%
Mortgage Type
FHA
Estimated Equity
$457,311
Purchase Details
Closed on
Aug 3, 2010
Sold by
Bac Home Loans Servicing Lp
Bought by
Federal Home Loan Mortgage Corporation
Purchase Details
Closed on
Mar 9, 2001
Sold by
Miller David
Bought by
Miller David and Miller Jacquelyn J
Home Financials for this Owner
Home Financials are based on the most recent Mortgage that was taken out on this home.
Original Mortgage
$260,400
Interest Rate
7.09%
Mortgage Type
New Conventional
Create a Home Valuation Report for This Property
The Home Valuation Report is an in-depth analysis detailing your home's value as well as a comparison with similar homes in the area
Home Values in the Area
Average Home Value in this Area
Purchase History
| Date | Buyer | Sale Price | Title Company |
|---|---|---|---|
| Jones Valencia Y | -- | -- | |
| Federal Home Loan Mortgage Corporation | -- | -- | |
| Bac Home Loans Servicing Lp | $321,651 | -- | |
| Miller David | -- | -- | |
| Miller David L | $325,600 | -- |
Source: Public Records
Mortgage History
| Date | Status | Borrower | Loan Amount |
|---|---|---|---|
| Open | Jones Valencia Y | $229,042 | |
| Previous Owner | Miller David L | $260,400 |
Source: Public Records
Tax History
| Year | Tax Paid | Tax Assessment Tax Assessment Total Assessment is a certain percentage of the fair market value that is determined by local assessors to be the total taxable value of land and additions on the property. | Land | Improvement |
|---|---|---|---|---|
| 2025 | $6,030 | $254,874 | $38,520 | $216,354 |
| 2024 | $5,871 | $238,200 | $36,000 | $202,200 |
| 2023 | $5,427 | $232,480 | $36,000 | $196,480 |
| 2022 | $4,538 | $205,280 | $36,000 | $169,280 |
| 2021 | $5,078 | $172,560 | $36,000 | $136,560 |
| 2020 | $5,024 | $163,360 | $21,600 | $141,760 |
| 2019 | $5,087 | $163,800 | $21,600 | $142,200 |
| 2018 | $4,885 | $153,280 | $21,600 | $131,680 |
| 2017 | $5,111 | $159,800 | $21,600 | $138,200 |
| 2016 | $4,516 | $138,360 | $21,600 | $116,760 |
| 2015 | $4,432 | $133,520 | $21,600 | $111,920 |
| 2014 | $3,919 | $116,040 | $21,600 | $94,440 |
| 2013 | -- | $110,280 | $0 | $0 |
Source: Public Records
Map
Nearby Homes
- 140 Devonshire Place
- 110 Wickham Dr
- 113 Creggan Hill Ct
- 250 Chimney Springs
- 260 Chimney Springs Rd
- 108 Tullamore Trail
- 255 Cicely Way
- 140 Julie Rd
- 377 Dogwood Trail
- 0 Erwin Run Unit 10585589
- 178 Crabapple Ln
- 155 Dean Dr
- 365 Pendleton Trail
- 0 Georgia 74
- 235 Ashmere Ct
- 105 Scott Blvd
- 175 Annabelle Ln
- 159 Sims Rd
- 125 Meadowview Cir
- 230 Smokerise Trace
- 230 Newfield Dr
- 210 Newfield Dr Unit 63
- 210 Newfield Dr
- 105 Castlebrook Chase
- 105 Devonshire Place
- 240 Newfield Dr
- 240 Newfield Dr Unit 60
- 205 Newfield Dr
- 195 Newfield Dr
- 250 Newfield Dr
- 245 Newfield Dr
- 125 Chatham Ct
- 100 Devonshire Place
- 185 Newfield Dr
- 185 Newfield Dr
- 185 Newfield Dr Unit 44
- 255 Newfield Dr
- 115 Chatham Ct
- 260 Newfield Dr
- 115 Castlebrook Chase
Your Personal Tour Guide
Ask me questions while you tour the home.