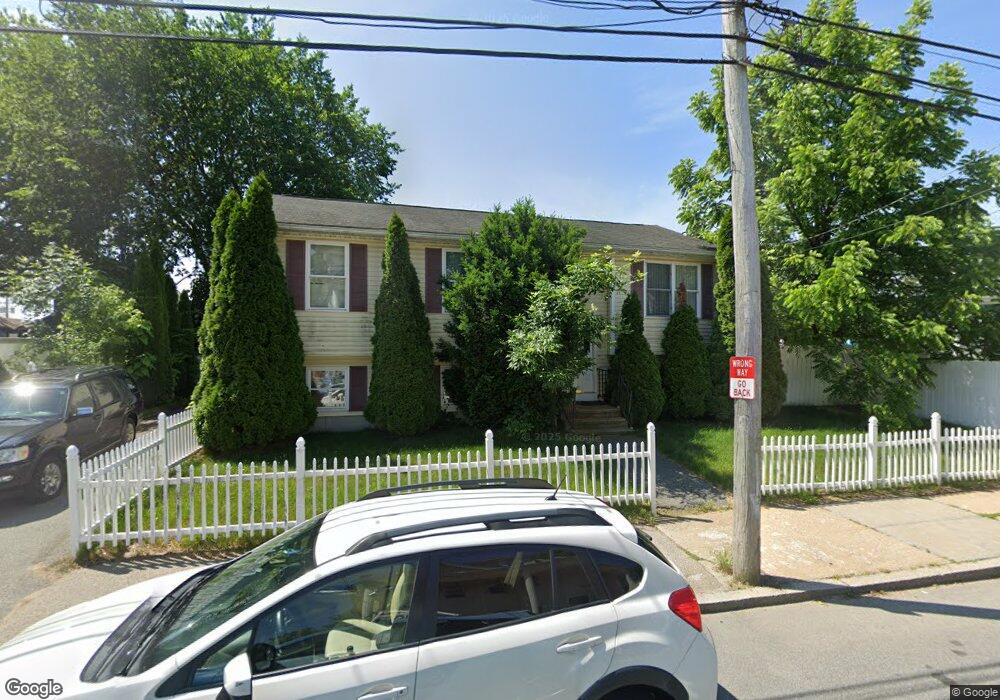
220 Northup St Cranston, RI 02905
Edgewood NeighborhoodEstimated Value: $359,000 - $497,000
4
Beds
2
Baths
960
Sq Ft
$430/Sq Ft
Est. Value
About This Home
This home is located at 220 Northup St, Cranston, RI 02905 and is currently estimated at $412,759, approximately $429 per square foot. 220 Northup St is a home located in Providence County with nearby schools including Edgewood Highland Elementary School, Park View Middle School, and Cranston High School East.
Ownership History
Date
Name
Owned For
Owner Type
Purchase Details
Closed on
Dec 5, 2008
Sold by
Lasalle Bk
Bought by
Watts Michael
Current Estimated Value
Purchase Details
Closed on
Jul 9, 2008
Sold by
Sanchez Nancy
Bought by
Lasalle Bank Na
Purchase Details
Closed on
Apr 20, 2007
Sold by
Rosado Jose
Bought by
Sanchez Nancy
Purchase Details
Closed on
Sep 16, 2005
Sold by
Santana Maria and Santana Luis
Bought by
Rosado Jose
Create a Home Valuation Report for This Property
The Home Valuation Report is an in-depth analysis detailing your home's value as well as a comparison with similar homes in the area
Home Values in the Area
Average Home Value in this Area
Purchase History
| Date | Buyer | Sale Price | Title Company |
|---|---|---|---|
| Watts Michael | $155,000 | -- | |
| Lasalle Bank Na | $219,500 | -- | |
| Sanchez Nancy | $250,000 | -- | |
| Rosado Jose | $285,000 | -- |
Source: Public Records
Mortgage History
| Date | Status | Borrower | Loan Amount |
|---|---|---|---|
| Open | Rosado Jose | $41,497 | |
| Open | Rosado Jose | $149,014 |
Source: Public Records
Tax History Compared to Growth
Tax History
| Year | Tax Paid | Tax Assessment Tax Assessment Total Assessment is a certain percentage of the fair market value that is determined by local assessors to be the total taxable value of land and additions on the property. | Land | Improvement |
|---|---|---|---|---|
| 2025 | $4,741 | $341,600 | $108,800 | $232,800 |
| 2024 | $4,649 | $341,600 | $108,800 | $232,800 |
| 2023 | $3,975 | $210,300 | $47,800 | $162,500 |
| 2022 | $3,893 | $210,300 | $47,800 | $162,500 |
| 2021 | $3,785 | $210,300 | $47,800 | $162,500 |
| 2020 | $3,633 | $174,900 | $37,500 | $137,400 |
| 2019 | $3,633 | $174,900 | $37,500 | $137,400 |
| 2018 | $3,549 | $174,900 | $37,500 | $137,400 |
| 2017 | $3,322 | $144,800 | $17,100 | $127,700 |
| 2016 | $3,251 | $144,800 | $17,100 | $127,700 |
| 2015 | $3,251 | $144,800 | $17,100 | $127,700 |
| 2014 | $2,734 | $119,700 | $17,100 | $102,600 |
Source: Public Records
Map
Nearby Homes
- 243 Bay View Ave
- 67 Armington St
- 358 Northup St
- 303 Narragansett St
- 274 Montgomery Ave
- 236 Vermont Ave
- 88 Wentworth Ave
- 208 California Ave
- 15 Wheeler Ave
- 160 Ohio Ave
- 180 Ohio Ave
- 115 Ohio Ave
- 218 Indiana Ave
- 255 Ohio Ave
- 312 California Ave
- 114 Norwood Ave
- 171 Norwood Ave
- 305 Indiana Ave
- 311 Indiana Ave
- 37 Farragut Ave
- 99 Northup St
- 226 Northup St
- 75 Northup St
- 1025 Narragansett Blvd
- 207 Smith St
- 197 Smith St
- 195 Smith St
- 215 Northup St
- 232 Northup St
- 213 Smith St
- 1027 Narragansett Blvd
- 223 Northup St
- 1015 Narragansett Blvd
- 229 Northup St
- 217 Smith St
- 1033 Narragansett Blvd
- 231 Northup St
- 236 Northup St
- 233 Northup St
- 164 Montgomery Ave