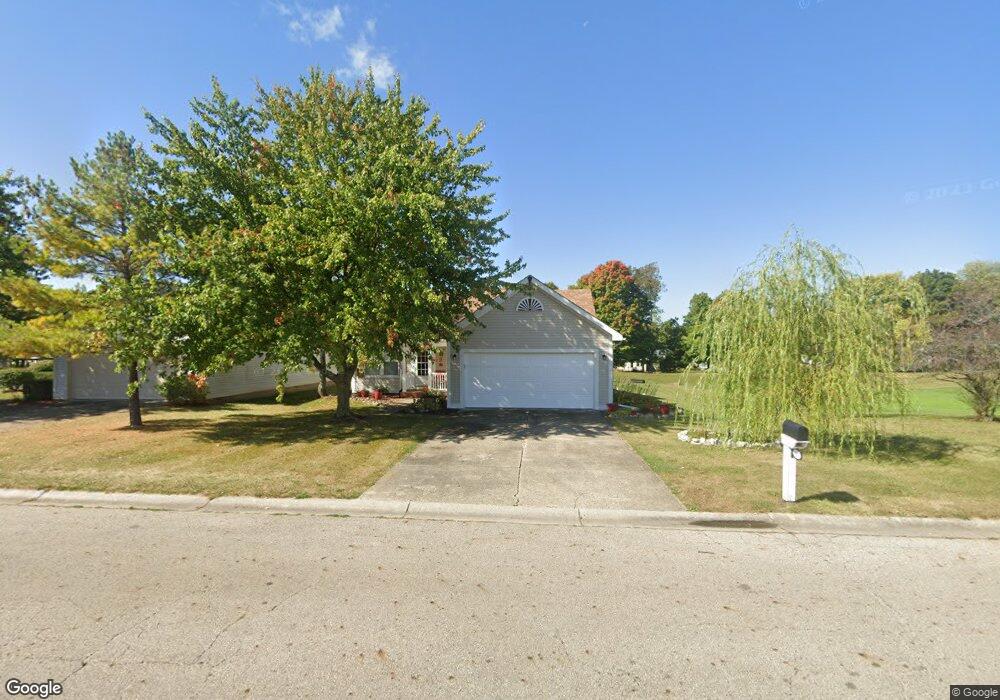
220 Parkway Blvd Unit 10 Urbana, OH 43078
Estimated Value: $183,784 - $207,000
3
Beds
2
Baths
1,170
Sq Ft
$165/Sq Ft
Est. Value
About This Home
This home is located at 220 Parkway Blvd Unit 10, Urbana, OH 43078 and is currently estimated at $192,696, approximately $164 per square foot. 220 Parkway Blvd Unit 10 is a home located in Champaign County with nearby schools including Urbana High School, Urbana Community School, and Victory Christian School.
Ownership History
Date
Name
Owned For
Owner Type
Purchase Details
Closed on
Nov 8, 2013
Sold by
Nigh Keith A and Nigh Stacie L
Bought by
Poe Catherine L
Current Estimated Value
Home Financials for this Owner
Home Financials are based on the most recent Mortgage that was taken out on this home.
Original Mortgage
$76,800
Outstanding Balance
$39,301
Interest Rate
4.24%
Mortgage Type
Purchase Money Mortgage
Estimated Equity
$153,395
Purchase Details
Closed on
Aug 22, 2006
Sold by
Miller Donald J and Miller Lori A
Bought by
Nigh Keith A and Nigh Stacie L
Home Financials for this Owner
Home Financials are based on the most recent Mortgage that was taken out on this home.
Original Mortgage
$95,501
Interest Rate
6.78%
Mortgage Type
FHA
Purchase Details
Closed on
Apr 24, 2002
Sold by
Lagos Thomas H
Bought by
Miller Donald J and Miller Lori A
Create a Home Valuation Report for This Property
The Home Valuation Report is an in-depth analysis detailing your home's value as well as a comparison with similar homes in the area
Home Values in the Area
Average Home Value in this Area
Purchase History
| Date | Buyer | Sale Price | Title Company |
|---|---|---|---|
| Poe Catherine L | $171,000 | None Available | |
| Nigh Keith A | $97,000 | Sterling Land Title Agency I | |
| Miller Donald J | $6,916 | -- |
Source: Public Records
Mortgage History
| Date | Status | Borrower | Loan Amount |
|---|---|---|---|
| Open | Poe Catherine L | $76,800 | |
| Previous Owner | Nigh Keith A | $95,501 |
Source: Public Records
Tax History Compared to Growth
Tax History
| Year | Tax Paid | Tax Assessment Tax Assessment Total Assessment is a certain percentage of the fair market value that is determined by local assessors to be the total taxable value of land and additions on the property. | Land | Improvement |
|---|---|---|---|---|
| 2024 | $2,030 | $49,360 | $6,270 | $43,090 |
| 2023 | $2,030 | $49,360 | $6,270 | $43,090 |
| 2022 | $2,071 | $49,360 | $6,270 | $43,090 |
| 2021 | $2,015 | $42,560 | $5,000 | $37,560 |
| 2020 | $2,015 | $42,560 | $5,000 | $37,560 |
| 2019 | $1,990 | $42,560 | $5,000 | $37,560 |
| 2018 | $1,855 | $37,930 | $4,900 | $33,030 |
| 2017 | $1,843 | $37,930 | $4,900 | $33,030 |
| 2016 | $1,847 | $37,930 | $4,900 | $33,030 |
| 2015 | $1,824 | $36,360 | $4,900 | $31,460 |
| 2014 | $1,826 | $36,360 | $4,900 | $31,460 |
| 2013 | $1,554 | $36,360 | $4,900 | $31,460 |
Source: Public Records
Map
Nearby Homes
- 220 Parkway Blvd Unit 2
- 220 Parkway Blvd Unit 5
- 220 Parkway Blvd Unit 12
- 220 Parkway Blvd Unit 1
- 220 Parkway Blvd Unit 14
- 220 Parkway Blvd Unit 3
- 220 Parkway Blvd Unit 15
- 220 Parkway Blvd Unit 13
- 220 Parkway Blvd Unit 11
- 220 Parkway Blvd Unit 9
- 220 Parkway Blvd Unit 8
- 220 Parkway Blvd Unit 7
- 220 Parkway Blvd Unit 6
- 220 Parkway Blvd Unit 4
- 220 Parkway Blvd
- 220 Parkway Blvd
- 220 Parkway Blvd Unit 5
- 220 Parkway Blvd
- 224 Parkway Blvd Unit 1
- 220 Parkway Blvd