Estimated Value: $377,000 - $456,000
3
Beds
4
Baths
2,217
Sq Ft
$183/Sq Ft
Est. Value
About This Home
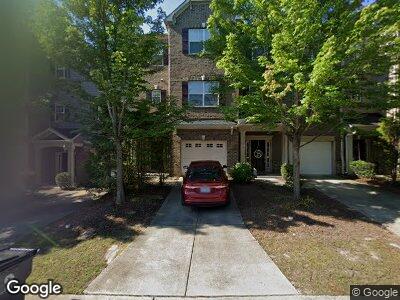
This home is located at 220 Presenteer Trail, Apex, NC 27539 and is currently estimated at $406,565, approximately $183 per square foot. 220 Presenteer Trail is a home located in Wake County with nearby schools including Lufkin Road Middle School, Apex Friendship High School, and Pine Springs Prep Academy.
Ownership History
Date
Name
Owned For
Owner Type
Purchase Details
Closed on
May 17, 2013
Sold by
Goncalves Jorge M and Goncalves Janice R
Bought by
Banks Cassandra Y
Current Estimated Value
Home Financials for this Owner
Home Financials are based on the most recent Mortgage that was taken out on this home.
Original Mortgage
$170,918
Outstanding Balance
$123,593
Interest Rate
3.56%
Mortgage Type
New Conventional
Estimated Equity
$282,972
Purchase Details
Closed on
Jan 30, 2009
Sold by
Mccar Homes Raleigh Llc
Bought by
Goncalves Jorge M and Goncalves Janice R
Home Financials for this Owner
Home Financials are based on the most recent Mortgage that was taken out on this home.
Original Mortgage
$162,459
Interest Rate
5.24%
Mortgage Type
Unknown
Purchase Details
Closed on
May 7, 2008
Sold by
Jer Mccar Associates Llc
Bought by
Mccar Homes Raleigh Llc
Create a Home Valuation Report for This Property
The Home Valuation Report is an in-depth analysis detailing your home's value as well as a comparison with similar homes in the area
Home Values in the Area
Average Home Value in this Area
Purchase History
| Date | Buyer | Sale Price | Title Company |
|---|---|---|---|
| Banks Cassandra Y | $167,500 | None Available | |
| Goncalves Jorge M | $181,000 | None Available | |
| Mccar Homes Raleigh Llc | $526,000 | None Available |
Source: Public Records
Mortgage History
| Date | Status | Borrower | Loan Amount |
|---|---|---|---|
| Open | Banks Cassandra Y | $170,918 | |
| Previous Owner | Goncalves Jorge M | $162,459 |
Source: Public Records
Tax History Compared to Growth
Tax History
| Year | Tax Paid | Tax Assessment Tax Assessment Total Assessment is a certain percentage of the fair market value that is determined by local assessors to be the total taxable value of land and additions on the property. | Land | Improvement |
|---|---|---|---|---|
| 2024 | $3,399 | $395,902 | $85,000 | $310,902 |
| 2023 | $2,730 | $247,031 | $55,000 | $192,031 |
| 2022 | $2,563 | $247,031 | $55,000 | $192,031 |
| 2021 | $2,466 | $247,031 | $55,000 | $192,031 |
| 2020 | $2,441 | $247,031 | $55,000 | $192,031 |
| 2019 | $2,199 | $191,852 | $38,000 | $153,852 |
| 2018 | $2,072 | $191,852 | $38,000 | $153,852 |
| 2017 | $1,929 | $191,852 | $38,000 | $153,852 |
| 2016 | $1,901 | $191,852 | $38,000 | $153,852 |
| 2015 | $1,969 | $194,070 | $41,000 | $153,070 |
| 2014 | $1,899 | $194,070 | $41,000 | $153,070 |
Source: Public Records
Map
Nearby Homes
- 117 Gallent Hedge Trail
- 4009 Reunion Creek Pkwy
- 102 Forrymast Trail
- 3341 Colby Chase Dr
- 3325 Colby Chase Dr Unit Lot 9
- 3331 Colby Chase Dr Unit Lot 8
- 3340 Colby Chase Dr Unit Lot 2
- 3621 Colby Chase Dr
- 111 Florians Dr
- 133 Florians Dr
- 684 Wickham Ridge Rd
- 709 Wickham Ridge Rd
- 102 Bella Place
- 736 Wickham Ridge Rd
- 746 Wickham Ridge Rd
- 2408 Merion Creek Dr
- 752 Wickham Ridge Rd
- 513 Commons Dr
- 228 Adefield Ln
- 112 Fairford Dr
- 220 Presenteer Trail
- 222 Presenteer Trail
- 218 Presenteer Trail
- 224 Presenteer Trail
- 216 Presenteer Trail
- 226 Presenteer Trail
- 228 Presenteer Trail
- 208 Presenteer Trail
- 4049 Reunion Creek Pkwy
- 4045 Reunion Creek Pkwy
- 206 Presenteer Trail
- 4053 Reunion Creek Pkwy
- 300 Presenteer Trail
- 219 Presenteer Trail
- 217 Presenteer Trail
- 221 Presenteer Trail
- 4041 Reunion Creek Pkwy
- 215 Presenteer Trail
- 213 Presenteer Trail
- 211 Presenteer Trail