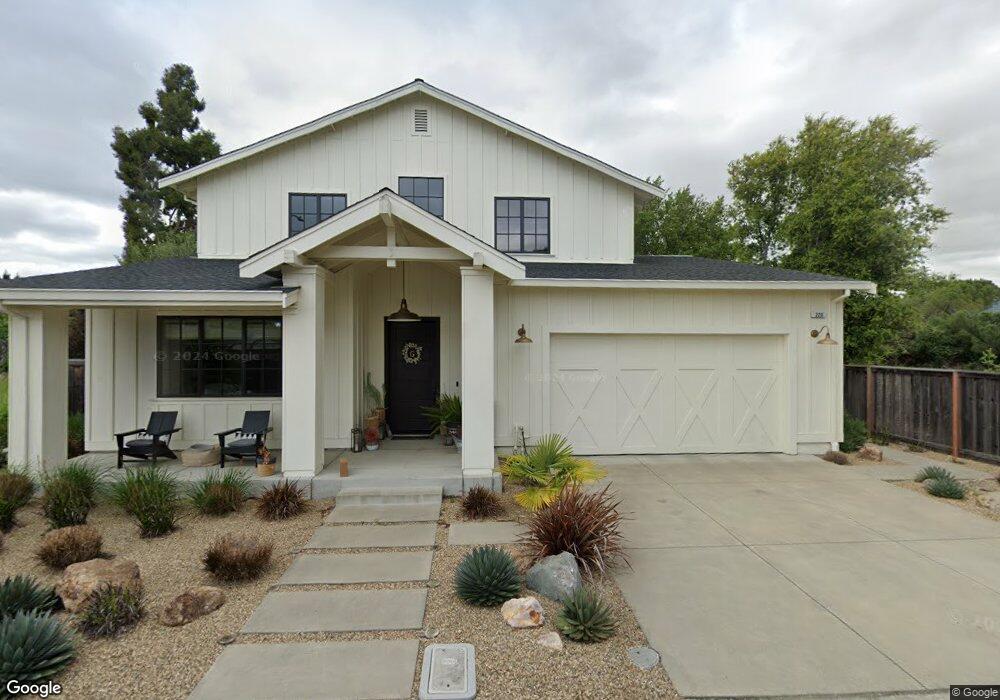
220 Ranch Ln Napa, CA 94558
Vintage NeighborhoodEstimated Value: $1,086,000 - $1,384,000
4
Beds
2
Baths
2,769
Sq Ft
$456/Sq Ft
Est. Value
About This Home
This home is located at 220 Ranch Ln, Napa, CA 94558 and is currently estimated at $1,262,338, approximately $455 per square foot. 220 Ranch Ln is a home with nearby schools including Willow Elementary School, Redwood Middle School, and Vintage High School.
Ownership History
Date
Name
Owned For
Owner Type
Purchase Details
Closed on
Nov 15, 2019
Sold by
Gibson Danielle A
Bought by
Gibson Danielle A and Gibson David K
Current Estimated Value
Home Financials for this Owner
Home Financials are based on the most recent Mortgage that was taken out on this home.
Original Mortgage
$500,500
Outstanding Balance
$336,270
Interest Rate
3.5%
Estimated Equity
$926,068
Purchase Details
Closed on
Jul 28, 2014
Sold by
Gibson David Kenneth
Bought by
Gibson Danielle A
Home Financials for this Owner
Home Financials are based on the most recent Mortgage that was taken out on this home.
Original Mortgage
$557,000
Interest Rate
4.13%
Mortgage Type
New Conventional
Purchase Details
Closed on
Jan 20, 2012
Sold by
Big Ranch Ii Llc
Bought by
Spinetta Piche Danielle
Purchase Details
Closed on
Jan 28, 2011
Sold by
Piche Gregory Mark
Bought by
Spinetta Piche Danielle
Create a Home Valuation Report for This Property
The Home Valuation Report is an in-depth analysis detailing your home's value as well as a comparison with similar homes in the area
Home Values in the Area
Average Home Value in this Area
Purchase History
| Date | Buyer | Sale Price | Title Company |
|---|---|---|---|
| Gibson Danielle A | -- | Fidelity National Title Co | |
| Gibson Danielle A | -- | Fidelity National Title Co | |
| Gibson Danielle A | -- | Fidelity National Title Co | |
| Spinetta Piche Danielle | $129,000 | Old Republic Title Company | |
| Spinetta Piche Danielle | -- | Old Republic Title Company |
Source: Public Records
Mortgage History
| Date | Status | Borrower | Loan Amount |
|---|---|---|---|
| Open | Gibson Danielle A | $500,500 | |
| Previous Owner | Gibson Danielle A | $557,000 |
Source: Public Records
Tax History
| Year | Tax Paid | Tax Assessment Tax Assessment Total Assessment is a certain percentage of the fair market value that is determined by local assessors to be the total taxable value of land and additions on the property. | Land | Improvement |
|---|---|---|---|---|
| 2025 | $10,143 | $836,243 | $162,023 | $674,220 |
| 2024 | $9,810 | $819,847 | $158,847 | $661,000 |
| 2023 | $9,810 | $803,773 | $155,733 | $648,040 |
| 2022 | $9,511 | $788,014 | $152,680 | $635,334 |
| 2021 | $9,377 | $772,564 | $149,687 | $622,877 |
| 2020 | $9,308 | $764,644 | $148,153 | $616,491 |
| 2019 | $9,119 | $749,652 | $145,249 | $604,403 |
| 2018 | $9,003 | $734,953 | $142,401 | $592,552 |
| 2017 | $8,830 | $720,543 | $139,609 | $580,934 |
| 2016 | $8,680 | $706,416 | $136,872 | $569,544 |
| 2015 | $8,135 | $695,806 | $134,817 | $560,989 |
| 2014 | $8,092 | $682,177 | $132,177 | $550,000 |
Source: Public Records
Map
Nearby Homes
- 71 Valley Club Cir
- 3552 Shelter Creek Dr
- 111 Firefly Ln
- 113 Firefly Ln
- 3495 Valle Verde Dr
- 10 Summerbrooke Cir
- 3476 Shelter Creek Dr
- 125 Valley Club Cir
- 77 Fountain Grove Cir
- 69 Fountain Grove Cir
- 5 Blackberry Dr
- 10 Culbertson Ct
- 11 Fountain Grove Cir
- 2243 Vandeleur Dr
- 39 Fountain Grove Cir
- 36 Fountain Grove Cir
- 127 Old Vine Way
- 2250 Vandeleur Dr
- 2298 Vandeleur Dr
- 3287 Von Uhlit Ranch Rd
- 224 Ranch Ln
- 127 Griffen Ln
- 1120 Serendipity Way
- 1126 Serendipity Way
- 121 Griffen Ln
- 2129 Big Ranch Rd
- 2133 Big Ranch Rd
- 1132 Serendipity Way
- 2127 Big Ranch Rd
- 2101 Big Ranch Rd
- 228 Ranch Ln
- 1127 Serendipity Way
- 958 Serendipity Way
- 972 Serendipity Way
- 1135 Serendipity Way
- 946 Serendipity Way
- 118 Griffen Ln
- 124 Griffen Ln
- 112 Griffen Ln
- 932 Serendipity Way
Your Personal Tour Guide
Ask me questions while you tour the home.