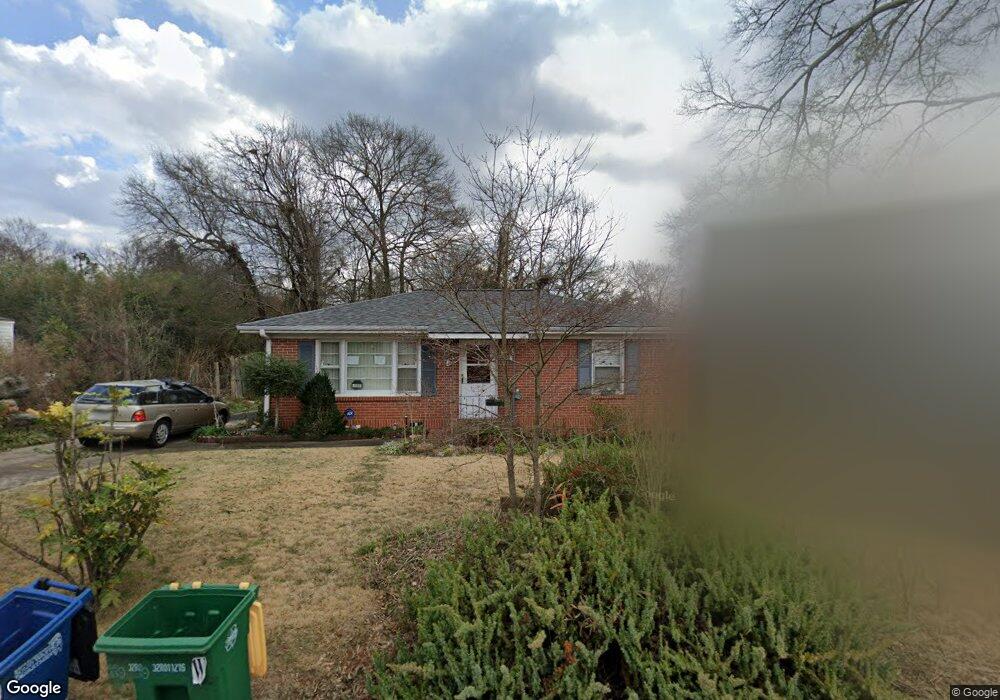
220 Ruth St Athens, GA 30601
North Avenue NeighborhoodEstimated Value: $177,014 - $262,000
Studio
--
Bath
888
Sq Ft
$242/Sq Ft
Est. Value
About This Home
This home is located at 220 Ruth St, Athens, GA 30601 and is currently estimated at $215,004, approximately $242 per square foot. 220 Ruth St is a home located in Clarke County with nearby schools including Howard B. Stroud Elementary School, Coile Middle School, and Cedar Shoals High School.
Ownership History
Date
Name
Owned For
Owner Type
Purchase Details
Closed on
Jun 10, 2002
Sold by
Housing & Economic Leadership
Bought by
Tomlinson Reid Lureen
Current Estimated Value
Purchase Details
Closed on
Apr 26, 2000
Sold by
Moon Carol
Bought by
Housing & Economic Leadership Partners
Purchase Details
Closed on
Feb 4, 2000
Sold by
Fogg Barbara Black
Bought by
Moon Carol
Create a Home Valuation Report for This Property
The Home Valuation Report is an in-depth analysis detailing your home's value as well as a comparison with similar homes in the area
Home Values in the Area
Average Home Value in this Area
Purchase History
| Date | Buyer | Sale Price | Title Company |
|---|---|---|---|
| Tomlinson Reid Lureen | $52,100 | -- | |
| Housing & Economic Leadership Partners | $56,800 | -- | |
| Moon Carol | $38,000 | -- |
Source: Public Records
Tax History
| Year | Tax Paid | Tax Assessment Tax Assessment Total Assessment is a certain percentage of the fair market value that is determined by local assessors to be the total taxable value of land and additions on the property. | Land | Improvement |
|---|---|---|---|---|
| 2025 | $740 | $58,334 | $24,000 | $34,334 |
| 2024 | $740 | $53,803 | $24,000 | $29,803 |
| 2023 | $151 | $51,179 | $24,000 | $27,179 |
| 2022 | $814 | $42,589 | $18,000 | $24,589 |
| 2021 | $786 | $37,290 | $18,000 | $19,290 |
| 2020 | $739 | $33,866 | $18,000 | $15,866 |
| 2019 | $722 | $32,198 | $17,000 | $15,198 |
| 2018 | $702 | $30,778 | $17,000 | $13,778 |
| 2017 | $0 | $30,611 | $17,000 | $13,611 |
| 2016 | $680 | $30,026 | $17,000 | $13,026 |
| 2015 | $681 | $30,026 | $17,000 | $13,026 |
| 2014 | $683 | $30,026 | $17,000 | $13,026 |
Source: Public Records
Map
Nearby Homes
- 455 Ruth St
- 118 Ruth Dr Unit 130
- 118 Ruth Dr Unit 140
- 211 North Ave Unit 1225
- 211 North Ave Unit 1334
- 211 North Ave
- 211 North Ave Unit 1227
- 464 Ruth St
- 239 Madison Heights
- 225 Fourth St
- 860 College Ave
- 668 Pulaski St
- 940 College Ave
- 447 Rosa Nell Howard St
- 600 Pulaski St
- 200 John St
- 220 John St
- 559 Pulaski St
- 495 Boley Dr
- 295 First St
- 210 Ruth St
- 230 Ruth St
- 238 Ruth St Unit 15
- 200 Ruth St
- 240 Ruth St
- 227 Ruth St
- 244 Ruth St
- 220 Ruth Dr
- 235 Ruth St
- 235 Ruth St
- 235 Ruth St Unit A & B
- 237 Ruth St Unit B
- 237 Ruth St
- 237 Ruth St Unit A & B
- 252 Ruth St
- 106 Magnolia Bluff Dr
- 112 Magnolia Bluff Dr
- 215 Ruth Dr
- 125 Trio Ln Unit A
- 125 Trio Ln
Your Personal Tour Guide
Ask me questions while you tour the home.