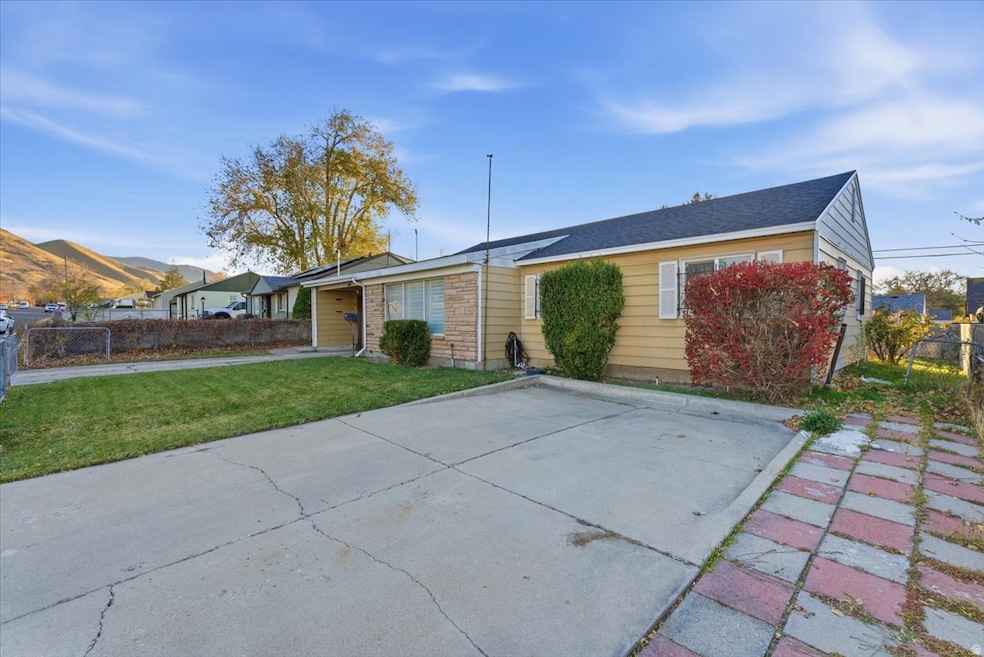
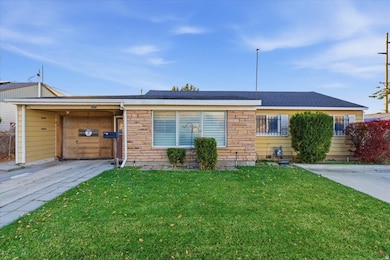
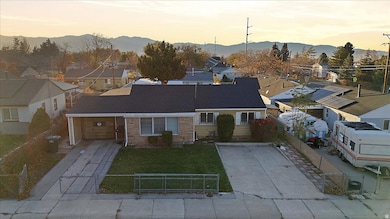
220 S 320 W Tooele, UT 84074
Estimated payment $1,908/month
Highlights
- Rambler Architecture
- 2 Car Attached Garage
- Landscaped
- No HOA
- Sliding Doors
- Central Heating and Cooling System
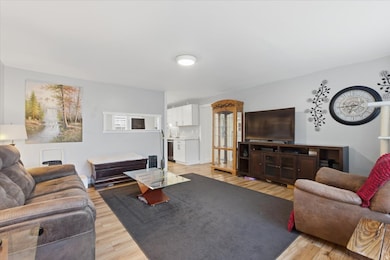
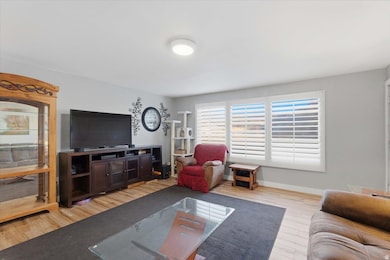
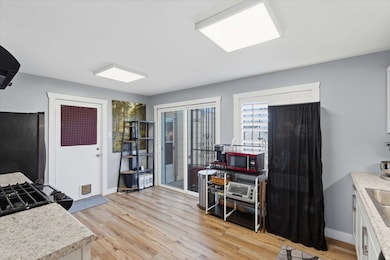
About This Home
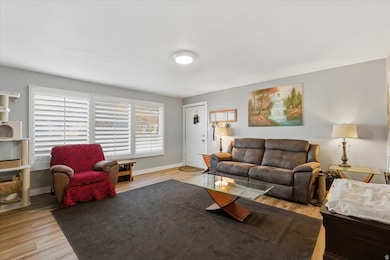
Beautiful 3-bedroom, 1 and .5-bath home in the heart of Tooele featuring a bright, updated kitchen, an inviting living space, and a spacious backyard perfect for relaxing or entertaining. Outside you'll find an RV pad with an RV dump, plus a two-car deep garage that gives you all the space you need for vehicles, toys, or storage. A solid home in a great neighborhood close to schools, parks, and shopping.
Listing Agent
Kyle Law
Iconic: Realty Network, LLP License #13040923 Listed on: 11/16/2025
Co-Listing Agent
Hailey Case
Iconic: Realty Network, LLP License #14135159
Open House Schedule
-
Saturday, November 29, 20253:00 to 5:00 pm11/29/2025 3:00:00 PM +00:0011/29/2025 5:00:00 PM +00:00Add to Calendar
Home Details
Home Type
- Single Family
Est. Annual Taxes
- $1,420
Year Built
- Built in 1953
Lot Details
- 6,098 Sq Ft Lot
- Property is Fully Fenced
- Landscaped
- Property is zoned Single-Family
Parking
- 2 Car Attached Garage
- 6 Open Parking Spaces
Home Design
- Rambler Architecture
Interior Spaces
- 2,004 Sq Ft Home
- 2-Story Property
- Ceiling Fan
- Blinds
- Sliding Doors
- Storm Doors
- Portable Dishwasher
- Electric Dryer Hookup
Bedrooms and Bathrooms
- 3 Main Level Bedrooms
Basement
- Walk-Out Basement
- Exterior Basement Entry
Schools
- Overlake Elementary School
- Tooele Middle School
- Tooele High School
Utilities
- Central Heating and Cooling System
- Natural Gas Connected
- Private Sewer
Community Details
- No Home Owners Association
- Pioneer Sub Subdivision
Listing and Financial Details
- Exclusions: Ceiling Fan, Dryer, Range, Range Hood, Refrigerator, Storage Shed(s)
- Assessor Parcel Number 10-013-0-0039
Map
Home Values in the Area
Average Home Value in this Area
Tax History
| Year | Tax Paid | Tax Assessment Tax Assessment Total Assessment is a certain percentage of the fair market value that is determined by local assessors to be the total taxable value of land and additions on the property. | Land | Improvement |
|---|---|---|---|---|
| 2025 | $1,844 | $279,603 | $80,300 | $199,303 |
| 2024 | $2,040 | $155,712 | $57,415 | $98,297 |
| 2023 | $2,040 | $142,681 | $55,983 | $86,698 |
| 2022 | $1,220 | $105,001 | $46,904 | $58,097 |
| 2021 | $1,784 | $128,349 | $36,080 | $92,269 |
| 2020 | $919 | $114,654 | $36,625 | $78,029 |
| 2019 | $934 | $114,654 | $36,625 | $78,029 |
| 2018 | $928 | $108,029 | $30,000 | $78,029 |
| 2017 | $787 | $108,729 | $30,000 | $78,729 |
| 2016 | $671 | $54,153 | $16,500 | $37,653 |
| 2015 | $671 | $48,798 | $0 | $0 |
| 2014 | -- | $48,798 | $0 | $0 |
Property History
| Date | Event | Price | List to Sale | Price per Sq Ft |
|---|---|---|---|---|
| 11/23/2025 11/23/25 | Pending | -- | -- | -- |
| 11/16/2025 11/16/25 | For Sale | $340,000 | -- | $170 / Sq Ft |
Purchase History
| Date | Type | Sale Price | Title Company |
|---|---|---|---|
| Warranty Deed | -- | Metro National Title | |
| Warranty Deed | -- | None Listed On Document |
Mortgage History
| Date | Status | Loan Amount | Loan Type |
|---|---|---|---|
| Open | $107,000 | New Conventional |
Source: UtahRealEstate.com
MLS Number: 2123175
APN: 10-013-0-0039
Disclaimer: Certain information contained herein is derived from information provided by parties other than Homes.com. All information provided is deemed reliable, but is not guaranteed to be accurate and should be independently verified.
![]() IDX information is provided exclusively for consumers’ personal, non-commercial use, that it may not be used for any purpose other than to identify prospective properties consumers may be interested in purchasing, and that the data is deemed reliable but is not guaranteed accurate by the MLS. Licensor is only providing the MLS Content and not other sources of data provided in the Product.
IDX information is provided exclusively for consumers’ personal, non-commercial use, that it may not be used for any purpose other than to identify prospective properties consumers may be interested in purchasing, and that the data is deemed reliable but is not guaranteed accurate by the MLS. Licensor is only providing the MLS Content and not other sources of data provided in the Product.
Based on information from the Wasatch Front Regional Multiple Listing Service, Inc.. All data, including all measurements and calculations of area, is obtained from various sources and has not been, and will not be, verified by broker or the MLS. All information should be independently reviewed and verified for accuracy. Properties may or may not be listed by the office/agent presenting the information.