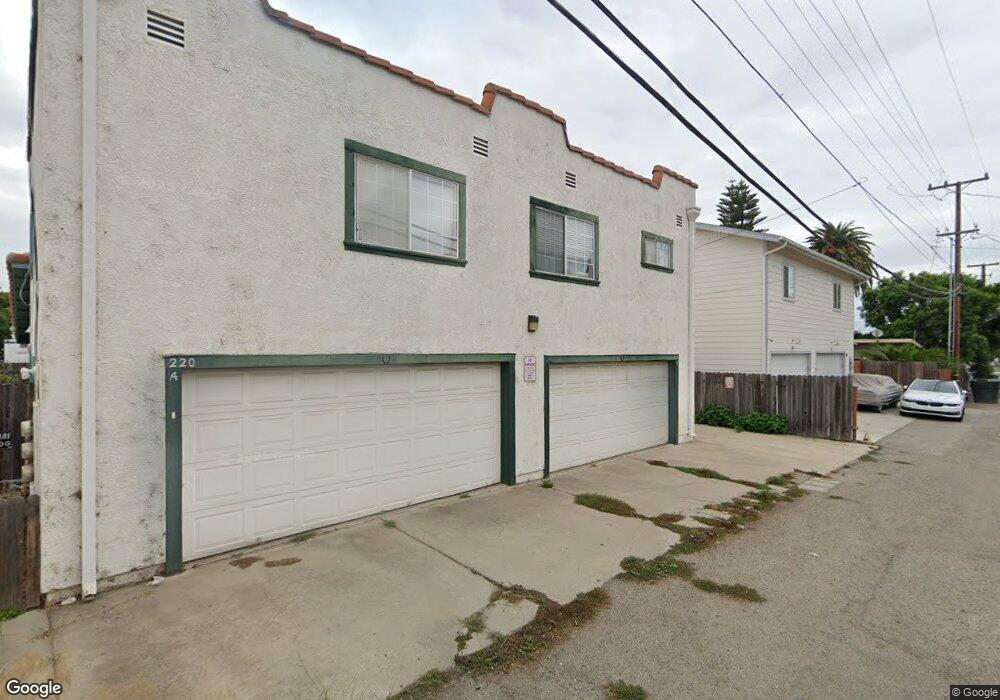
220 S I St Unit B Lompoc, CA 93436
Estimated Value: $230,121 - $359,000
1
Bed
1
Bath
552
Sq Ft
$539/Sq Ft
Est. Value
About This Home
This home is located at 220 S I St Unit B, Lompoc, CA 93436 and is currently estimated at $297,530, approximately $539 per square foot. 220 S I St Unit B is a home located in Santa Barbara County with nearby schools including Arthur Hapgood Elementary School, Lompoc Valley Middle School, and Lompoc High School.
Ownership History
Date
Name
Owned For
Owner Type
Purchase Details
Closed on
Aug 16, 2023
Sold by
Hodge Dorian A
Bought by
Dorian Hodge Trust and Hodge
Current Estimated Value
Purchase Details
Closed on
Mar 13, 2001
Sold by
Roth Helen
Bought by
Hodge Dorian A
Home Financials for this Owner
Home Financials are based on the most recent Mortgage that was taken out on this home.
Original Mortgage
$88,600
Interest Rate
7.15%
Purchase Details
Closed on
Dec 10, 1993
Sold by
Knoell Michael C
Bought by
Roth Helen
Home Financials for this Owner
Home Financials are based on the most recent Mortgage that was taken out on this home.
Original Mortgage
$60,300
Interest Rate
7.09%
Create a Home Valuation Report for This Property
The Home Valuation Report is an in-depth analysis detailing your home's value as well as a comparison with similar homes in the area
Home Values in the Area
Average Home Value in this Area
Purchase History
| Date | Buyer | Sale Price | Title Company |
|---|---|---|---|
| Dorian Hodge Trust | -- | None Listed On Document | |
| Hodge Dorian A | $111,000 | Chicago Title Co | |
| Roth Helen | $67,000 | First American Title |
Source: Public Records
Mortgage History
| Date | Status | Borrower | Loan Amount |
|---|---|---|---|
| Previous Owner | Hodge Dorian A | $88,600 | |
| Previous Owner | Roth Helen | $60,300 |
Source: Public Records
Tax History
| Year | Tax Paid | Tax Assessment Tax Assessment Total Assessment is a certain percentage of the fair market value that is determined by local assessors to be the total taxable value of land and additions on the property. | Land | Improvement |
|---|---|---|---|---|
| 2025 | $1,832 | $196,855 | $45,191 | $151,664 |
| 2023 | $1,832 | $160,378 | $43,437 | $116,941 |
| 2022 | $1,800 | $157,235 | $42,586 | $114,649 |
| 2021 | $1,820 | $154,152 | $41,751 | $112,401 |
| 2020 | $1,801 | $152,572 | $41,323 | $111,249 |
| 2019 | $1,771 | $149,581 | $40,513 | $109,068 |
| 2018 | $1,743 | $146,649 | $39,719 | $106,930 |
| 2017 | $1,712 | $143,775 | $38,941 | $104,834 |
| 2016 | $1,681 | $140,957 | $38,178 | $102,779 |
| 2014 | $1,645 | $136,122 | $36,869 | $99,253 |
Source: Public Records
Map
Nearby Homes
Your Personal Tour Guide
Ask me questions while you tour the home.