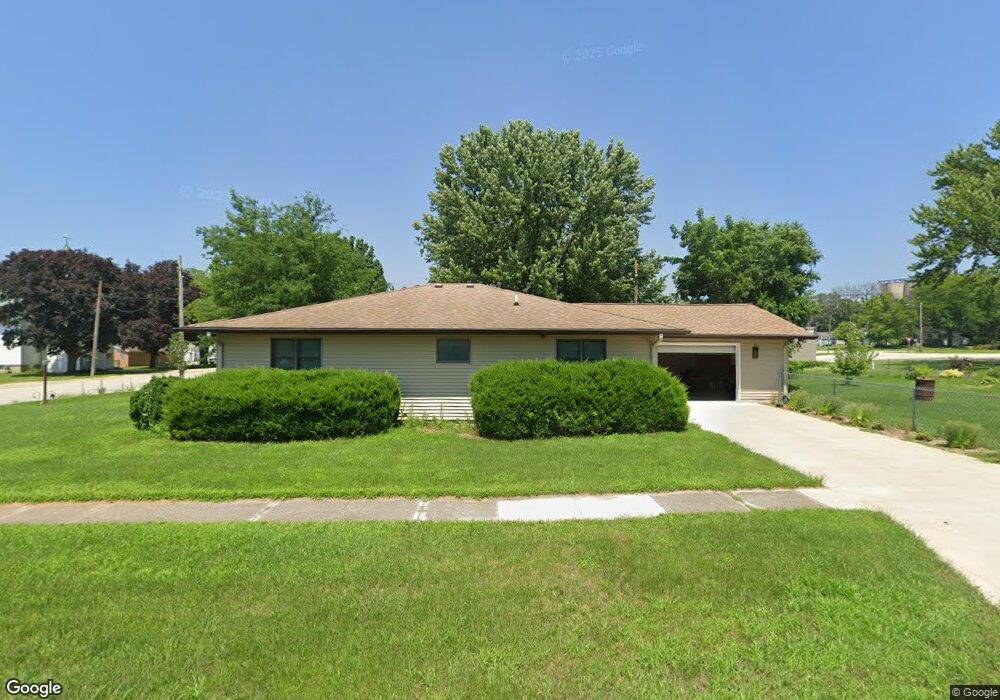
220 S Main Marble Rock, IA 50653
Estimated Value: $138,000 - $199,000
2
Beds
3
Baths
3,108
Sq Ft
$51/Sq Ft
Est. Value
About This Home
This home is located at 220 S Main, Marble Rock, IA 50653 and is currently estimated at $159,127, approximately $51 per square foot. 220 S Main is a home located in Floyd County with nearby schools including Rudd-Rockford-Marble Rock Elementary School and Rockford Junior/Senior High School.
Ownership History
Date
Name
Owned For
Owner Type
Purchase Details
Closed on
Jul 2, 2020
Sold by
Morgan Douglas E
Bought by
Morgan Denise L
Current Estimated Value
Create a Home Valuation Report for This Property
The Home Valuation Report is an in-depth analysis detailing your home's value as well as a comparison with similar homes in the area
Purchase History
| Date | Buyer | Sale Price | Title Company |
|---|---|---|---|
| Morgan Denise L | -- | None Available |
Source: Public Records
Tax History
| Year | Tax Paid | Tax Assessment Tax Assessment Total Assessment is a certain percentage of the fair market value that is determined by local assessors to be the total taxable value of land and additions on the property. | Land | Improvement |
|---|---|---|---|---|
| 2025 | $1,836 | $125,520 | $5,450 | $120,070 |
| 2024 | $1,836 | $129,800 | $5,450 | $124,350 |
| 2023 | $1,596 | $129,800 | $5,450 | $124,350 |
| 2022 | $1,454 | $99,040 | $5,450 | $93,590 |
| 2021 | $1,250 | $89,490 | $5,450 | $84,040 |
| 2020 | $1,250 | $75,490 | $5,450 | $70,040 |
| 2019 | $1,876 | $104,720 | $5,450 | $99,270 |
| 2018 | $1,706 | $95,700 | $5,450 | $90,250 |
| 2017 | $1,568 | $95,700 | $5,450 | $90,250 |
| 2016 | $732 | $95,700 | $5,450 | $90,250 |
| 2015 | $732 | $85,390 | $3,270 | $82,120 |
| 2014 | -- | $85,390 | $3,270 | $82,120 |
Source: Public Records
Map
Nearby Homes
Your Personal Tour Guide
Ask me questions while you tour the home.