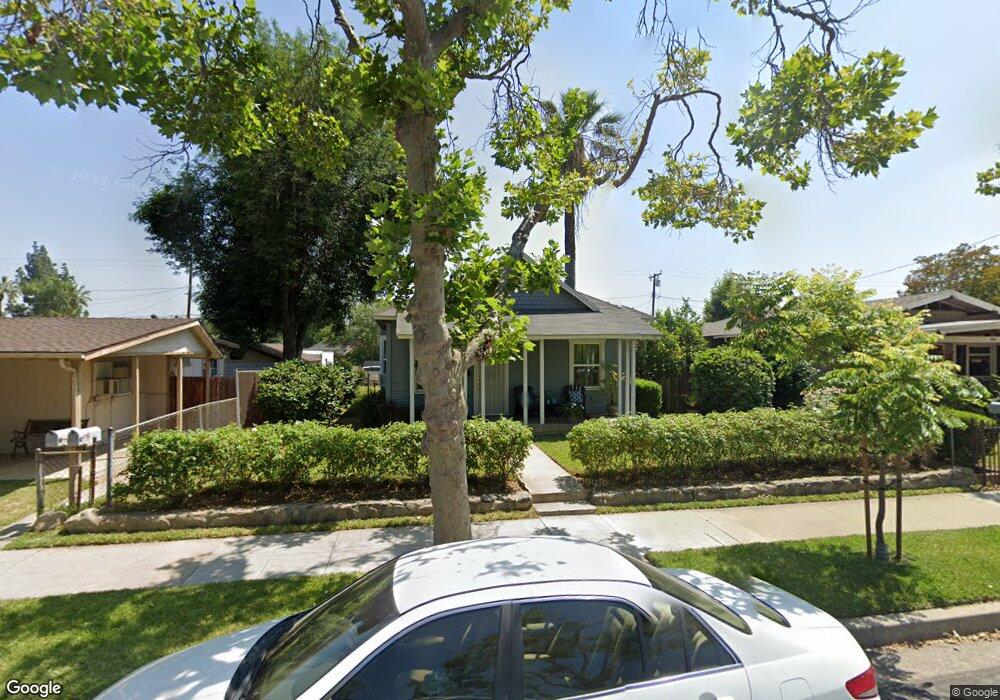
220 W 3rd St San Dimas, CA 91773
Estimated Value: $590,000 - $689,000
2
Beds
1
Bath
964
Sq Ft
$680/Sq Ft
Est. Value
About This Home
This home is located at 220 W 3rd St, San Dimas, CA 91773 and is currently estimated at $655,943, approximately $680 per square foot. 220 W 3rd St is a home located in Los Angeles County with nearby schools including Fred Ekstrand Elementary School, Lone Hill Middle School, and San Dimas High School.
Ownership History
Date
Name
Owned For
Owner Type
Purchase Details
Closed on
Sep 12, 2018
Sold by
Button Jerry
Bought by
Button Michael L and Button Amella E
Current Estimated Value
Purchase Details
Closed on
Apr 22, 2010
Sold by
Button Jerry and Button Cora Ann
Bought by
Button Jerry
Home Financials for this Owner
Home Financials are based on the most recent Mortgage that was taken out on this home.
Original Mortgage
$203,000
Interest Rate
4.92%
Mortgage Type
New Conventional
Purchase Details
Closed on
Sep 5, 2000
Sold by
Held Paul D and Estate Of Anna Etta Noah
Bought by
Button Jerry
Home Financials for this Owner
Home Financials are based on the most recent Mortgage that was taken out on this home.
Original Mortgage
$132,811
Interest Rate
8.13%
Mortgage Type
FHA
Create a Home Valuation Report for This Property
The Home Valuation Report is an in-depth analysis detailing your home's value as well as a comparison with similar homes in the area
Home Values in the Area
Average Home Value in this Area
Purchase History
| Date | Buyer | Sale Price | Title Company |
|---|---|---|---|
| Button Michael L | $139,000 | Title Source Inc | |
| Button Jerry | -- | Fidelity National Title Co | |
| Button Jerry | $134,000 | Fidelity National Title |
Source: Public Records
Mortgage History
| Date | Status | Borrower | Loan Amount |
|---|---|---|---|
| Previous Owner | Button Jerry | $203,000 | |
| Previous Owner | Button Jerry | $132,811 |
Source: Public Records
Tax History
| Year | Tax Paid | Tax Assessment Tax Assessment Total Assessment is a certain percentage of the fair market value that is determined by local assessors to be the total taxable value of land and additions on the property. | Land | Improvement |
|---|---|---|---|---|
| 2025 | $2,776 | $201,436 | $161,219 | $40,217 |
| 2024 | $2,776 | $197,487 | $158,058 | $39,429 |
| 2023 | $2,714 | $193,615 | $154,959 | $38,656 |
| 2022 | $2,666 | $189,820 | $151,921 | $37,899 |
| 2021 | $2,608 | $186,099 | $148,943 | $37,156 |
| 2019 | $2,557 | $180,581 | $144,526 | $36,055 |
| 2018 | $2,391 | $177,042 | $141,693 | $35,349 |
| 2017 | $122 | $173,571 | $138,915 | $34,656 |
| 2016 | $2,295 | $170,169 | $136,192 | $33,977 |
| 2015 | $4,457 | $167,614 | $134,147 | $33,467 |
| 2014 | $2,248 | $164,332 | $131,520 | $32,812 |
Source: Public Records
Map
Nearby Homes
- 0 0 W 5th St
- 0 Dallas Rd Unit WS25141209
- 150 S Monte Vista Ave
- 100 Rawlinsdale Ln
- 442 Walker Rd
- 208 E 3rd St
- 214 E 4th St
- 158 E Commercial St
- 254 E 4th St
- 317 Pony Express Rd
- 539 W Gladstone St
- 850 Tucson Ct
- 0 8678-030-029 Unit WS22023659
- 206 San Luis Rey Dr
- 736 N Walnut Ave
- 167 E Via Vaquero
- 631 Pearlanna Dr
- 606 N Pershore Ave
- 0 E De Anza Heights Dr
- 362 W Via Vaquero
Your Personal Tour Guide
Ask me questions while you tour the home.