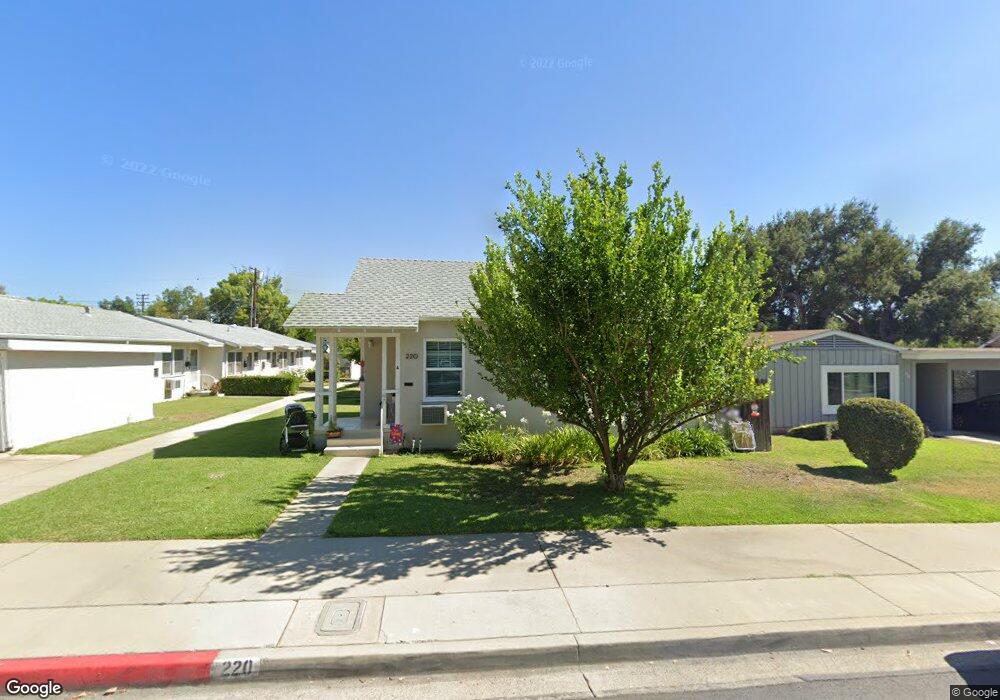
220 W Lime Ave Monrovia, CA 91016
Estimated Value: $971,000 - $1,218,000
5
Beds
3
Baths
2,397
Sq Ft
$469/Sq Ft
Est. Value
About This Home
This home is located at 220 W Lime Ave, Monrovia, CA 91016 and is currently estimated at $1,123,667, approximately $468 per square foot. 220 W Lime Ave is a home located in Los Angeles County with nearby schools including Monroe Elementary School, Santa Fe Computer Science Magnet, and Monrovia High School.
Ownership History
Date
Name
Owned For
Owner Type
Purchase Details
Closed on
Nov 9, 2015
Sold by
Abernathy Mark
Bought by
Mb Equity Llc
Current Estimated Value
Purchase Details
Closed on
Dec 13, 2012
Sold by
Abernathy David P and Abernathy Nancy S
Bought by
Abernathy Mark and Abernathy Brian
Purchase Details
Closed on
Oct 17, 2012
Sold by
Abernathy Kerri Lean
Bought by
Abernathy Mark
Purchase Details
Closed on
Apr 15, 2008
Sold by
Aim Equity Llc
Bought by
Aim Equity Llc
Home Financials for this Owner
Home Financials are based on the most recent Mortgage that was taken out on this home.
Original Mortgage
$744,000
Interest Rate
6.11%
Mortgage Type
Balloon
Purchase Details
Closed on
Sep 27, 2006
Sold by
Abernathy David P and Abernathy Nancy S
Bought by
Aim Equity Llc
Purchase Details
Closed on
Dec 15, 2003
Sold by
Abernathy David P and Abernathy Nancy S
Bought by
Aim Equity Llc
Create a Home Valuation Report for This Property
The Home Valuation Report is an in-depth analysis detailing your home's value as well as a comparison with similar homes in the area
Home Values in the Area
Average Home Value in this Area
Purchase History
| Date | Buyer | Sale Price | Title Company |
|---|---|---|---|
| Mb Equity Llc | -- | Accommodation | |
| Abernathy Mark | $656,000 | North American Title | |
| Abernathy David P | -- | Natc | |
| Abernathy David P | -- | Natc | |
| Abernathy Mark | -- | Natc | |
| Abernathy Brian | -- | Natc | |
| Aim Equity Llc | -- | North American Title | |
| Aim Equity Llc | -- | None Available | |
| Aim Equity Llc | -- | -- |
Source: Public Records
Mortgage History
| Date | Status | Borrower | Loan Amount |
|---|---|---|---|
| Previous Owner | Aim Equity Llc | $744,000 |
Source: Public Records
Tax History
| Year | Tax Paid | Tax Assessment Tax Assessment Total Assessment is a certain percentage of the fair market value that is determined by local assessors to be the total taxable value of land and additions on the property. | Land | Improvement |
|---|---|---|---|---|
| 2025 | $5,786 | $371,292 | $99,508 | $271,784 |
| 2024 | $5,786 | $364,012 | $97,557 | $266,455 |
| 2023 | $5,664 | $356,876 | $95,645 | $261,231 |
| 2022 | $5,513 | $349,879 | $93,770 | $256,109 |
| 2021 | $5,400 | $343,020 | $91,932 | $251,088 |
| 2019 | $5,172 | $333,368 | $89,206 | $244,162 |
| 2018 | $4,977 | $326,842 | $87,457 | $239,385 |
| 2016 | $4,779 | $313,653 | $84,062 | $229,591 |
| 2015 | $4,681 | $308,943 | $82,800 | $226,143 |
| 2014 | -- | $302,893 | $81,179 | $221,714 |
Source: Public Records
Map
Nearby Homes
- 210 W Lime Ave
- 347 W Lemon Ave
- 267 Linwood Ave Unit E
- 334 Linwood Ave
- 709 S Magnolia Ave
- 305 S Mayflower Ave
- 137 N Myrtle Ave
- 113 N Ivy Ave Unit 113 & 115
- 244 E Lime Ave
- 516 Linwood Ave
- 210 E Walnut Ave Unit J
- 105 S Mayflower Ave Unit E
- 550 W Foothill Blvd Unit C
- 318 S Canyon Blvd
- 228 Oaks Ave
- 179 N Ivy Ave
- 205 Violet Ave Unit D
- 511 W Maple Ave
- 221 Violet Ave
- 250 N Primrose Ave
- 228 W Lime Ave
- 232 W Lime Ave
- 200 W Lime Ave Unit D
- 200 W Lime Ave
- 200 W Lime Ave Unit H
- 200 W Lime Ave Unit D
- 200 W Lime Ave Unit G
- 200 W Lime Ave Unit C
- 200 W Lime Ave Unit F
- 200 W Lime Ave Unit B
- 200 W Lime Ave Unit E
- 200 W Lime Ave Unit A
- 215 W Lemon Ave Unit D
- 215 W Lemon Ave Unit B
- 215 W Lemon Ave
- 209 W Lemon Ave
- 225 W Lemon Ave
- 219 W Lime Ave
- 415 S Primrose Ave
- 217 W Lime Ave
Your Personal Tour Guide
Ask me questions while you tour the home.