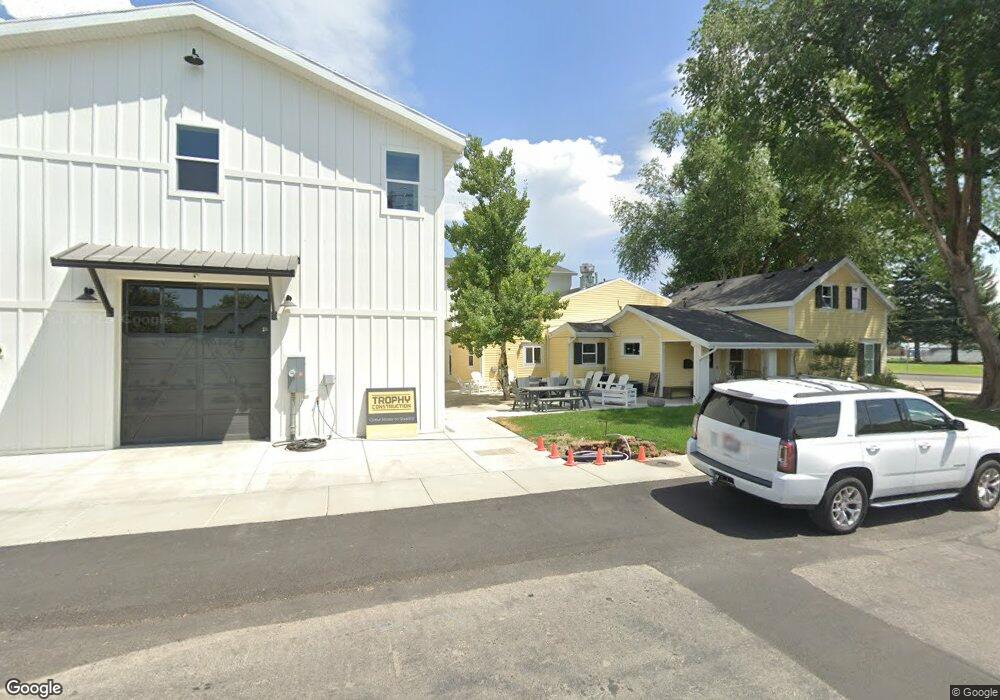
220 W Main St Midway, UT 84049
Estimated Value: $956,000 - $1,232,000
Studio
--
Bath
2,587
Sq Ft
$415/Sq Ft
Est. Value
About This Home
This home is located at 220 W Main St, Midway, UT 84049 and is currently estimated at $1,073,077, approximately $414 per square foot. 220 W Main St is a home located in Wasatch County with nearby schools including Midway Elementary School, Rocky Mountain Middle School, and Wasatch High School.
Ownership History
Date
Name
Owned For
Owner Type
Purchase Details
Closed on
Aug 21, 2019
Sold by
Pine Hill Avenue Llc
Bought by
Pine Hill Ave Llc
Current Estimated Value
Purchase Details
Closed on
Nov 28, 2017
Sold by
Fox Susan M
Bought by
Pine Hill Avenue Llc
Home Financials for this Owner
Home Financials are based on the most recent Mortgage that was taken out on this home.
Original Mortgage
$527,000
Interest Rate
3.94%
Mortgage Type
Commercial
Purchase Details
Closed on
Jan 25, 2016
Sold by
Ellertsn Kerry and Ellertsn Virgina
Bought by
Fox Susan M
Create a Home Valuation Report for This Property
The Home Valuation Report is an in-depth analysis detailing your home's value as well as a comparison with similar homes in the area
Home Values in the Area
Average Home Value in this Area
Purchase History
| Date | Buyer | Sale Price | Title Company |
|---|---|---|---|
| Pine Hill Ave Llc | -- | Atlas Title Insurance Heber | |
| Pine Hill Avenue Llc | -- | Atlas Title Insurance Heber | |
| Fox Susan M | $41,000 | None Available |
Source: Public Records
Mortgage History
| Date | Status | Borrower | Loan Amount |
|---|---|---|---|
| Previous Owner | Pine Hill Avenue Llc | $527,000 |
Source: Public Records
Tax History
| Year | Tax Paid | Tax Assessment Tax Assessment Total Assessment is a certain percentage of the fair market value that is determined by local assessors to be the total taxable value of land and additions on the property. | Land | Improvement |
|---|---|---|---|---|
| 2025 | $7,188 | $780,000 | $360,000 | $420,000 |
| 2024 | $7,107 | $780,000 | $360,000 | $420,000 |
| 2023 | $7,107 | $780,000 | $360,000 | $420,000 |
| 2022 | $6,846 | $682,769 | $279,000 | $403,769 |
| 2021 | $1,139 | $159,611 | $150,000 | $9,611 |
| 2020 | $954 | $129,611 | $120,000 | $9,611 |
| 2019 | $872 | $71,286 | $0 | $0 |
| 2018 | $872 | $71,286 | $0 | $0 |
| 2017 | $633 | $51,387 | $0 | $0 |
| 2016 | $649 | $51,387 | $0 | $0 |
| 2015 | $616 | $51,387 | $0 | $0 |
| 2014 | $641 | $51,387 | $0 | $0 |
Source: Public Records
Map
Nearby Homes
Your Personal Tour Guide
Ask me questions while you tour the home.