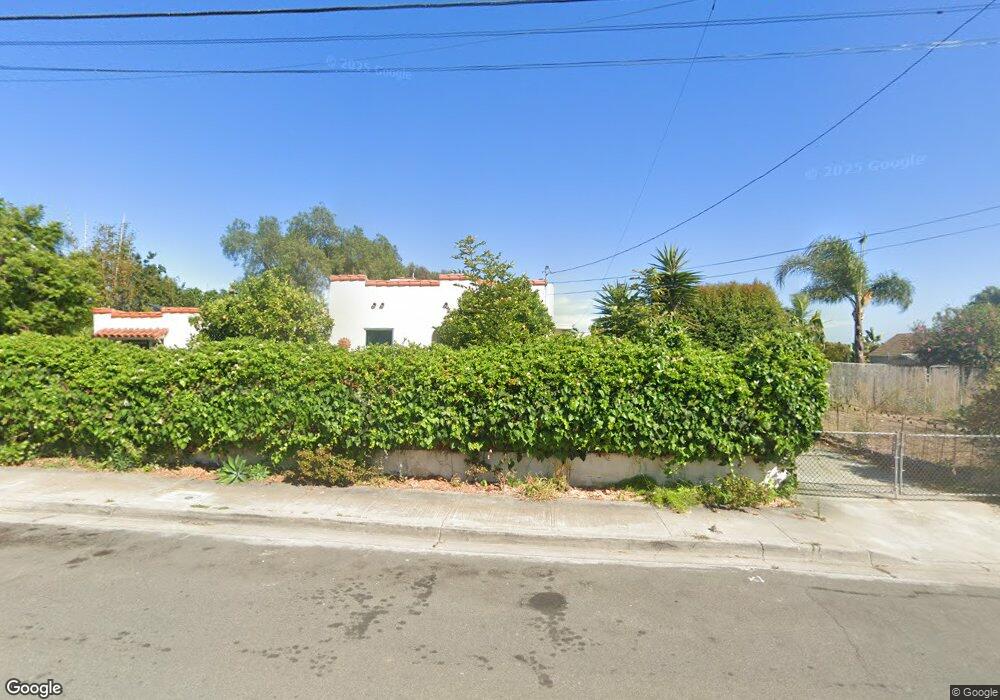
220 Walsh St Oceanside, CA 92054
Loma Alta NeighborhoodEstimated Value: $920,000 - $1,285,000
4
Beds
2
Baths
2,444
Sq Ft
$464/Sq Ft
Est. Value
About This Home
This home is located at 220 Walsh St, Oceanside, CA 92054 and is currently estimated at $1,133,229, approximately $463 per square foot. 220 Walsh St is a home located in San Diego County with nearby schools including Mission Elementary School, Oceanside High School, and Oceanside Adventist Elementary School.
Ownership History
Date
Name
Owned For
Owner Type
Purchase Details
Closed on
Jul 20, 2004
Sold by
Yoder Victor L and Yoder Cheryl A
Bought by
Yoder Victor L and Yoder Cheryl A
Current Estimated Value
Purchase Details
Closed on
May 28, 1998
Sold by
Home Svgs Of America Fsb
Bought by
Yoder Victor L and Yoder Cheryl A
Home Financials for this Owner
Home Financials are based on the most recent Mortgage that was taken out on this home.
Original Mortgage
$170,362
Interest Rate
6.93%
Mortgage Type
FHA
Purchase Details
Closed on
Apr 9, 1998
Sold by
David Marrs
Bought by
Home Svgs Of America Fsb
Home Financials for this Owner
Home Financials are based on the most recent Mortgage that was taken out on this home.
Original Mortgage
$170,362
Interest Rate
6.93%
Mortgage Type
FHA
Purchase Details
Closed on
Apr 9, 1992
Purchase Details
Closed on
Nov 2, 1984
Create a Home Valuation Report for This Property
The Home Valuation Report is an in-depth analysis detailing your home's value as well as a comparison with similar homes in the area
Home Values in the Area
Average Home Value in this Area
Purchase History
| Date | Buyer | Sale Price | Title Company |
|---|---|---|---|
| Yoder Victor L | -- | -- | |
| Yoder Victor L | $158,000 | Old Republic Title Company | |
| Home Svgs Of America Fsb | $170,000 | First American Title Ins Co | |
| -- | $199,000 | -- | |
| -- | $124,000 | -- |
Source: Public Records
Mortgage History
| Date | Status | Borrower | Loan Amount |
|---|---|---|---|
| Previous Owner | Yoder Victor L | $170,362 |
Source: Public Records
Tax History
| Year | Tax Paid | Tax Assessment Tax Assessment Total Assessment is a certain percentage of the fair market value that is determined by local assessors to be the total taxable value of land and additions on the property. | Land | Improvement |
|---|---|---|---|---|
| 2025 | $2,688 | $247,675 | $94,049 | $153,626 |
| 2024 | $2,688 | $242,819 | $92,205 | $150,614 |
| 2023 | $2,604 | $238,059 | $90,398 | $147,661 |
| 2022 | $2,563 | $233,392 | $88,626 | $144,766 |
| 2021 | $2,571 | $228,817 | $86,889 | $141,928 |
| 2020 | $2,492 | $226,472 | $85,999 | $140,473 |
| 2019 | $2,419 | $222,032 | $84,313 | $137,719 |
| 2018 | $2,392 | $217,679 | $82,660 | $135,019 |
| 2017 | $2,347 | $213,412 | $81,040 | $132,372 |
| 2016 | $2,269 | $209,228 | $79,451 | $129,777 |
| 2015 | $2,202 | $206,086 | $78,258 | $127,828 |
| 2014 | $2,117 | $202,051 | $76,726 | $125,325 |
Source: Public Records
Map
Nearby Homes
- 506 Canyon Dr Unit 6
- 506 Canyon Dr Unit 85
- 2245 Hilldale St
- 230 Hoover St
- 116 N Barnwell St
- 1786 Jasmine Way
- 519 Camelot Dr
- 306 Fowles St
- 2713 Lancelot Dr
- 415 Stoney Point Way Unit 106
- 223 Cottingham Ct
- 430 Stoney Point Way Unit 129
- 445 Ribbon Beach Way Unit 278
- 405 Ribbon Beach Way Unit 249
- 503 505 N Nevada St
- 1427 Avocado Rd
- 2306 Loker Way
- 2308 Loker Way
- 509 Rockledge St
- 2312 Loker Way
Your Personal Tour Guide
Ask me questions while you tour the home.