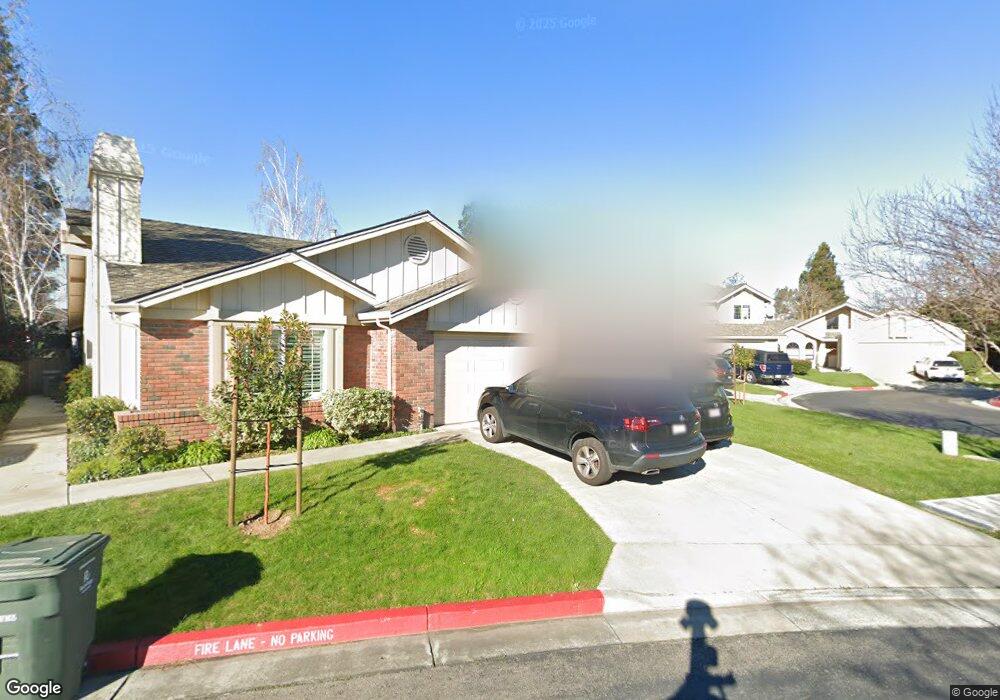
2200 Bayo Claros Cir Morgan Hill, CA 95037
Estimated Value: $1,238,000 - $1,287,918
4
Beds
3
Baths
1,883
Sq Ft
$665/Sq Ft
Est. Value
About This Home
This home is located at 2200 Bayo Claros Cir, Morgan Hill, CA 95037 and is currently estimated at $1,252,230, approximately $665 per square foot. 2200 Bayo Claros Cir is a home located in Santa Clara County with nearby schools including Nordstrom Elementary School, Martin Murphy Middle School, and Live Oak High School.
Ownership History
Date
Name
Owned For
Owner Type
Purchase Details
Closed on
Jun 13, 2003
Sold by
Truman James Kelly
Bought by
Vogelaar Robertus E and Vogelaar Alicia J
Current Estimated Value
Home Financials for this Owner
Home Financials are based on the most recent Mortgage that was taken out on this home.
Original Mortgage
$322,000
Outstanding Balance
$138,490
Interest Rate
5.53%
Mortgage Type
Purchase Money Mortgage
Estimated Equity
$1,113,740
Purchase Details
Closed on
Aug 21, 1998
Sold by
Biggs Gerald G and Biggs Monique L
Bought by
Clausen Mark L and Clausen Amanda M
Home Financials for this Owner
Home Financials are based on the most recent Mortgage that was taken out on this home.
Original Mortgage
$303,200
Interest Rate
9.25%
Create a Home Valuation Report for This Property
The Home Valuation Report is an in-depth analysis detailing your home's value as well as a comparison with similar homes in the area
Home Values in the Area
Average Home Value in this Area
Purchase History
| Date | Buyer | Sale Price | Title Company |
|---|---|---|---|
| Vogelaar Robertus E | $489,000 | Fidelity National Title Ins | |
| Clausen Mark L | $379,000 | Commonwealth Land Title Co |
Source: Public Records
Mortgage History
| Date | Status | Borrower | Loan Amount |
|---|---|---|---|
| Open | Vogelaar Robertus E | $322,000 | |
| Previous Owner | Clausen Mark L | $303,200 | |
| Closed | Clausen Mark L | $37,900 | |
| Closed | Vogelaar Robertus E | $51,000 |
Source: Public Records
Tax History Compared to Growth
Tax History
| Year | Tax Paid | Tax Assessment Tax Assessment Total Assessment is a certain percentage of the fair market value that is determined by local assessors to be the total taxable value of land and additions on the property. | Land | Improvement |
|---|---|---|---|---|
| 2025 | $7,935 | $708,214 | $311,526 | $396,688 |
| 2024 | $7,935 | $694,328 | $305,418 | $388,910 |
| 2023 | $7,832 | $680,715 | $299,430 | $381,285 |
| 2022 | $7,699 | $667,368 | $293,559 | $373,809 |
| 2021 | $7,504 | $654,283 | $287,803 | $366,480 |
| 2020 | $7,322 | $647,575 | $284,852 | $362,723 |
| 2019 | $7,528 | $634,878 | $279,267 | $355,611 |
| 2018 | $7,549 | $622,431 | $273,792 | $348,639 |
| 2017 | $7,477 | $610,227 | $268,424 | $341,803 |
| 2016 | $7,000 | $598,262 | $263,161 | $335,101 |
| 2015 | $6,924 | $589,277 | $259,209 | $330,068 |
| 2014 | $7,018 | $577,735 | $254,132 | $323,603 |
Source: Public Records
Map
Nearby Homes
- 17061 Teak Ct
- 2300 Bayo Claros Cir
- 1760 Almond Way
- 16895 Cabernet Ct
- 16935 Pine Way
- 1910 Conte Way
- 16935 Sugar Pine Dr
- 17152 Tassajara Cir
- 181 E Dunne Ave
- 183 E Dunne Ave
- 185 E Dunne Ave
- 187 E Dunne Ave Unit 37
- 189 E Dunne Ave
- 191 E Dunne Ave
- 193 E Dunne Ave
- 16700 Fountain Ave
- 2352 Leptis Cir
- 2386 Leptis Cir
- 2275 E Dunne Ave
- 2460 Magnolia Way
- 2210 Bayo Claros Cir
- 2190 Bayo Claros Cir
- 2220 Bayo Claros Cir
- 17120 Pine Way
- 2180 Bayo Claros Cir
- 17130 Pine Way
- 2160 Bayo Claros Cir
- 2215 Bayo Claros Cir
- 2230 Bayo Claros Cir
- 2170 Bayo Claros Cir
- 1680 Bluebonnet Way
- 17110 Pine Way
- 2225 Bayo Claros Cir
- 2150 Bayo Claros Cir
- 2240 Bayo Claros Cir
- 1830 Bluebonnet Ct
- 1670 Bluebonnet Way
- 2235 Bayo Claros Cir
- 17100 Pine Way
- 17140 Pine Way