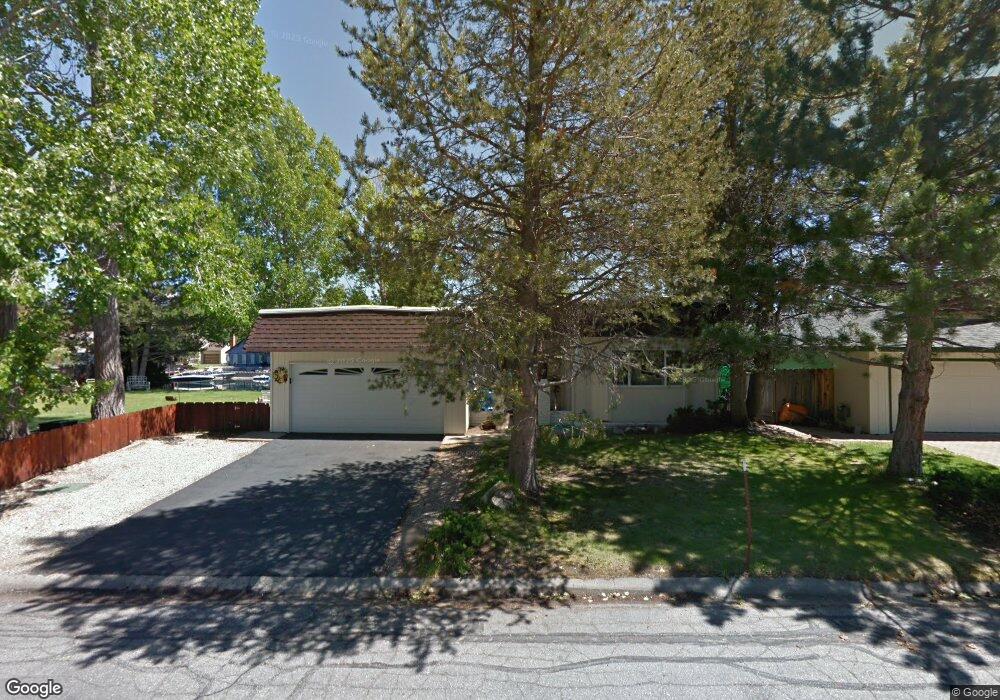
2200 Morro Dr South Lake Tahoe, CA 96150
Estimated Value: $785,000 - $845,650
4
Beds
2
Baths
1,476
Sq Ft
$557/Sq Ft
Est. Value
About This Home
This home is located at 2200 Morro Dr, South Lake Tahoe, CA 96150 and is currently estimated at $822,413, approximately $557 per square foot. 2200 Morro Dr is a home located in El Dorado County with nearby schools including Tahoe Valley Elementary School, South Tahoe Middle School, and South Tahoe High School.
Ownership History
Date
Name
Owned For
Owner Type
Purchase Details
Closed on
Jan 22, 2020
Sold by
G & M Ramsey Properties Llc
Bought by
Ramsey Kimberley Alison Harris and William D Ramsey Revocable Tru
Current Estimated Value
Purchase Details
Closed on
Apr 9, 2014
Sold by
Ramsey William Davis
Bought by
G & M Ramsey Properties Llc
Purchase Details
Closed on
Mar 20, 2014
Sold by
Ramsey George Roger
Bought by
G & M Ramsey Properties Llc
Purchase Details
Closed on
Feb 5, 2013
Sold by
Carr Vicki Lynn Ramsey
Bought by
Carr William J and Carr Vicki L Ramsey
Purchase Details
Closed on
May 21, 2010
Sold by
Ramsey William and Ramsey George B
Bought by
Ramsey William Davis and Ramsey George Roger
Create a Home Valuation Report for This Property
The Home Valuation Report is an in-depth analysis detailing your home's value as well as a comparison with similar homes in the area
Home Values in the Area
Average Home Value in this Area
Purchase History
| Date | Buyer | Sale Price | Title Company |
|---|---|---|---|
| Ramsey Kimberley Alison Harris | -- | None Available | |
| G & M Ramsey Properties Llc | -- | None Available | |
| G & M Ramsey Properties Llc | -- | None Available | |
| G & M Ramsey Properties Llc | -- | None Available | |
| Carr Vicki Lynn Ramsey | -- | None Available | |
| Carr Vicki Lynn Ramsey | -- | None Available | |
| Carr William J | -- | None Available | |
| Ramsey William Davis | -- | None Available |
Source: Public Records
Tax History Compared to Growth
Tax History
| Year | Tax Paid | Tax Assessment Tax Assessment Total Assessment is a certain percentage of the fair market value that is determined by local assessors to be the total taxable value of land and additions on the property. | Land | Improvement |
|---|---|---|---|---|
| 2025 | $5,003 | $472,700 | $202,819 | $269,881 |
| 2024 | $5,003 | $463,433 | $198,843 | $264,590 |
| 2023 | $1,572 | $138,916 | $42,369 | $96,547 |
| 2022 | $1,557 | $136,193 | $41,539 | $94,654 |
| 2021 | $1,533 | $133,524 | $40,725 | $92,799 |
| 2020 | $1,512 | $132,156 | $40,308 | $91,848 |
| 2019 | $1,505 | $129,566 | $39,518 | $90,048 |
| 2018 | $1,472 | $127,027 | $38,744 | $88,283 |
| 2017 | $1,450 | $124,537 | $37,985 | $86,552 |
| 2016 | $1,421 | $122,096 | $37,241 | $84,855 |
| 2015 | $1,351 | $120,265 | $36,683 | $83,582 |
| 2014 | $1,351 | $117,911 | $35,965 | $81,946 |
Source: Public Records
Map
Nearby Homes
- 2185 Morro Dr
- 569 Lucerne Way
- 555 Tahoe Keys Blvd Unit 13
- 2081 Venice Dr Unit 285
- 2081 Venice Dr Unit 280
- 2071 Venice Dr Unit 294
- 497 Tahoe Keys Blvd Unit 20
- 2244 Texas Ave
- 489 Tahoe Keys Blvd Unit 68
- 489 Tahoe Keys Blvd Unit 47
- 489 Tahoe Keys Blvd Unit 55
- 489 Tahoe Keys Blvd Unit 56
- 2191 Butler Ave
- 552 Christie Dr Unit 307
- 2031 Venice Dr Unit 322
- 741 Tahoe Island Dr
- 477 Ala Wai Blvd Unit 91
- 724 Tahoe Island Dr
- 439 Ala Wai Blvd Unit 106
- 439 Ala Wai Blvd Unit 111