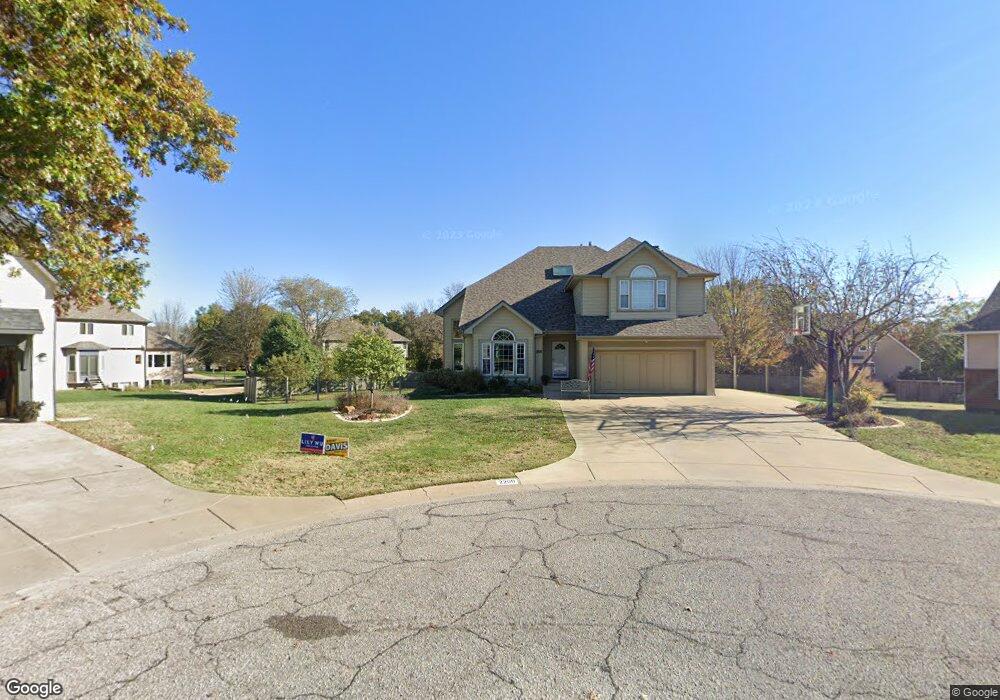
2200 N Stoneybrook Cir Wichita, KS 67226
Northeast Wichita NeighborhoodEstimated Value: $383,000 - $413,121
5
Beds
4
Baths
3,357
Sq Ft
$119/Sq Ft
Est. Value
About This Home
This home is located at 2200 N Stoneybrook Cir, Wichita, KS 67226 and is currently estimated at $398,061, approximately $118 per square foot. 2200 N Stoneybrook Cir is a home located in Sedgwick County with nearby schools including Minneha Core Knowledge Elementary School, Coleman Environmental Magnet Middle School, and Wichita Southeast High School.
Ownership History
Date
Name
Owned For
Owner Type
Purchase Details
Closed on
Aug 30, 2017
Sold by
Davis Brent T and Davis Tinka G
Bought by
Davis Brent T and Davis Tinka G
Current Estimated Value
Purchase Details
Closed on
May 20, 2011
Sold by
Kerley Michael D and Kerley Debra K
Bought by
Davis Tinka G
Home Financials for this Owner
Home Financials are based on the most recent Mortgage that was taken out on this home.
Original Mortgage
$229,042
Outstanding Balance
$158,217
Interest Rate
4.75%
Mortgage Type
FHA
Estimated Equity
$239,844
Purchase Details
Closed on
Apr 20, 2007
Sold by
Barrett Joan M
Bought by
Kerley Michael D and Kerley Debra K
Home Financials for this Owner
Home Financials are based on the most recent Mortgage that was taken out on this home.
Original Mortgage
$198,800
Interest Rate
6.1%
Mortgage Type
New Conventional
Purchase Details
Closed on
Aug 27, 1999
Sold by
Lawton Steven K and Lawton Shari Lynn
Bought by
Burger Gregory D and Burger Nancy K
Home Financials for this Owner
Home Financials are based on the most recent Mortgage that was taken out on this home.
Original Mortgage
$66,000
Interest Rate
7.65%
Create a Home Valuation Report for This Property
The Home Valuation Report is an in-depth analysis detailing your home's value as well as a comparison with similar homes in the area
Home Values in the Area
Average Home Value in this Area
Purchase History
| Date | Buyer | Sale Price | Title Company |
|---|---|---|---|
| Davis Brent T | -- | None Available | |
| Davis Tinka G | -- | Security 1St Title | |
| Kerley Michael D | -- | None Available | |
| Burger Gregory D | $210,000 | -- |
Source: Public Records
Mortgage History
| Date | Status | Borrower | Loan Amount |
|---|---|---|---|
| Open | Davis Tinka G | $229,042 | |
| Previous Owner | Kerley Michael D | $198,800 | |
| Previous Owner | Burger Gregory D | $66,000 |
Source: Public Records
Tax History Compared to Growth
Tax History
| Year | Tax Paid | Tax Assessment Tax Assessment Total Assessment is a certain percentage of the fair market value that is determined by local assessors to be the total taxable value of land and additions on the property. | Land | Improvement |
|---|---|---|---|---|
| 2025 | $4,322 | $41,216 | $9,269 | $31,947 |
| 2023 | $4,322 | $39,239 | $7,694 | $31,545 |
| 2022 | $4,020 | $35,651 | $7,257 | $28,394 |
| 2021 | $3,818 | $33,006 | $4,497 | $28,509 |
| 2020 | $3,663 | $31,741 | $4,497 | $27,244 |
| 2019 | $3,526 | $30,522 | $4,497 | $26,025 |
| 2018 | $3,434 | $29,636 | $2,254 | $27,382 |
| 2017 | $3,335 | $0 | $0 | $0 |
| 2016 | $3,235 | $0 | $0 | $0 |
| 2015 | $3,322 | $0 | $0 | $0 |
| 2014 | $3,255 | $0 | $0 | $0 |
Source: Public Records
Map
Nearby Homes
- 2323 N Stoneybrook Ct
- 10227 E Windemere Ct
- 2455 N Regency Lakes Ct
- 10231 E Windemere Ct
- 2507 N Cranbrook Ct
- 2526 N Fox Run
- 1906 N Frederic Cir
- 9400 E Wilson Estates Pkwy
- 2530 N Greenleaf Ct
- 1810 N Veranda St
- 10611 E Summerfield Cir
- 9510 E Shannon Woods St
- 8913 E Boxthorn St
- 8811 E Churchill Cir
- 8812 E Churchill Cir
- 2610 N Wilderness Cir
- 2230 N Penstemon Ct
- 1440 N Gatewood #22
- 1440 N Gatewood #37
- 8319 E Oxford Cir
- 2202 N Stoneybrook Cir
- 2223 N Lindberg St
- 2201 N Stoneybrook Cir
- 2219 N Lindberg St
- 10301 E Boxthorn St
- 10209 E Boxthorn St
- 10205 E Boxthorn St
- 2203 N Stoneybrook Cir
- 2215 N Lindberg St
- 2204 N Stoneybrook Cir
- 2205 N Stoneybrook Cir
- 2222 N Lindberg St
- 10201 E Boxthorn St
- 10214 E Boxthorn St
- 10302 E Boxthorn St
- 2226 N Lindberg St
- 2218 N Lindberg St
- 10210 E Peppertree St
- 10306 E Boxthorn St
- 10206 E Peppertree St