Estimated Value: $244,549 - $265,000
3
Beds
2
Baths
1,704
Sq Ft
$150/Sq Ft
Est. Value
About This Home
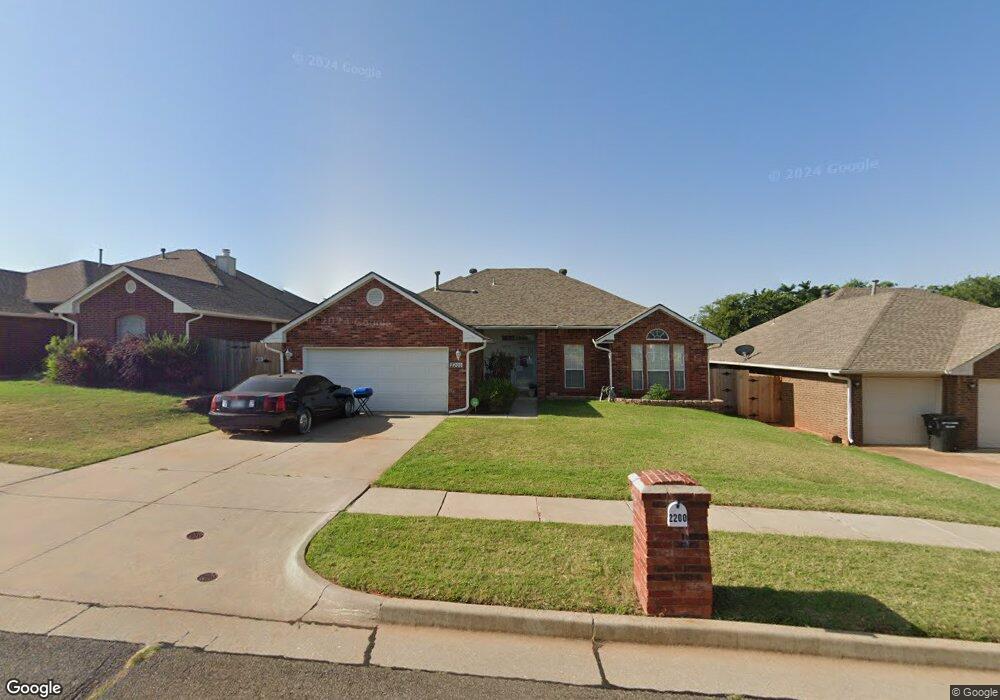
This home is located at 2200 NE 4th St, Moore, OK 73160 and is currently estimated at $256,137, approximately $150 per square foot. 2200 NE 4th St is a home located in Cleveland County with nearby schools including Heritage Trails Elementary School, Highland East Junior High School, and Moore High School.
Ownership History
Date
Name
Owned For
Owner Type
Purchase Details
Closed on
Jul 18, 2013
Sold by
Edwards Sabah and Robinson Shulonda
Bought by
Robinson Shulonda
Current Estimated Value
Home Financials for this Owner
Home Financials are based on the most recent Mortgage that was taken out on this home.
Original Mortgage
$95,232
Outstanding Balance
$46,481
Interest Rate
3.99%
Mortgage Type
New Conventional
Estimated Equity
$209,656
Purchase Details
Closed on
Aug 16, 2012
Sold by
Hohenberger Bobbie Lou
Bought by
Hohenberger Bobbie Lou and The Bobbie Lou Hohenberg Revocable Trust
Purchase Details
Closed on
Dec 16, 2011
Sold by
Robinson Sabah Edwards and Robinson Shulonda
Bought by
Robinson Shulonda
Purchase Details
Closed on
Jul 18, 2003
Sold by
Vesta Homes, Inc
Bought by
Edwards Sabah Adane Shulonda
Purchase Details
Closed on
Sep 4, 2002
Sold by
Purchasers Investments, Inc
Bought by
Marquis Homes, Inc
Create a Home Valuation Report for This Property
The Home Valuation Report is an in-depth analysis detailing your home's value as well as a comparison with similar homes in the area
Home Values in the Area
Average Home Value in this Area
Purchase History
| Date | Buyer | Sale Price | Title Company |
|---|---|---|---|
| Robinson Shulonda | -- | Title One Llc | |
| Hohenberger Bobbie Lou | -- | None Available | |
| Robinson Shulonda | $20,000 | None Available | |
| Edwards Sabah Adane Shulonda | $124,000 | -- | |
| Marquis Homes, Inc | $16,500 | -- |
Source: Public Records
Mortgage History
| Date | Status | Borrower | Loan Amount |
|---|---|---|---|
| Open | Robinson Shulonda | $95,232 |
Source: Public Records
Tax History Compared to Growth
Tax History
| Year | Tax Paid | Tax Assessment Tax Assessment Total Assessment is a certain percentage of the fair market value that is determined by local assessors to be the total taxable value of land and additions on the property. | Land | Improvement |
|---|---|---|---|---|
| 2024 | $2,834 | $23,364 | $4,691 | $18,673 |
| 2023 | $2,712 | $22,252 | $4,596 | $17,656 |
| 2022 | $2,621 | $21,192 | $3,685 | $17,507 |
| 2021 | $2,509 | $20,183 | $3,607 | $16,576 |
| 2020 | $2,389 | $19,222 | $3,740 | $15,482 |
| 2019 | $2,318 | $18,307 | $2,400 | $15,907 |
| 2018 | $2,318 | $18,307 | $2,400 | $15,907 |
| 2017 | $2,330 | $18,307 | $0 | $0 |
| 2016 | $2,347 | $18,307 | $2,400 | $15,907 |
| 2015 | $2,096 | $18,068 | $1,980 | $16,088 |
| 2014 | $2,051 | $17,273 | $1,980 | $15,293 |
Source: Public Records
Map
Nearby Homes
- 609 Madeline Ln
- 604 Loyd Ln
- 2224 NE 8th St
- 930 Estell Dr
- 920 Elm Creek Dr
- 112 Wellington Ln
- 1824 NE 11th St
- 1809 Parkway Dr
- 1100 David Rd
- 1109 David Rd
- 2105 NE 11th St
- 401 S Bryant Ave
- 1105 Oak Creek Dr
- 1317 Washington Cir
- 2100 SE 5th St
- 205 N Ramblin Oaks Dr
- 104 S Ramblin Oaks Dr
- 1401 NE 11th St
- 1200 NE 5th St
- 204 S Morgan Dr