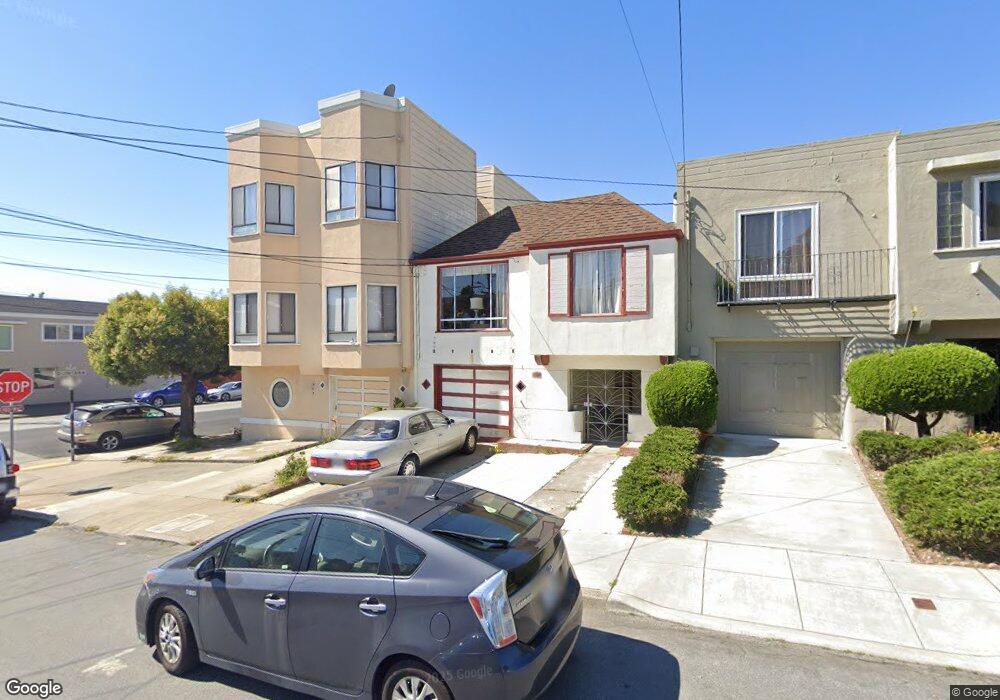
2200 Quintara St San Francisco, CA 94116
Parkside NeighborhoodEstimated Value: $1,855,000 - $2,291,000
5
Beds
3
Baths
3,216
Sq Ft
$630/Sq Ft
Est. Value
About This Home
This home is located at 2200 Quintara St, San Francisco, CA 94116 and is currently estimated at $2,027,099, approximately $630 per square foot. 2200 Quintara St is a home located in San Francisco County with nearby schools including Stevenson (Robert Louis) Elementary School, Giannini (A.P.) Middle School, and St. Ignatius College Preparatory School.
Ownership History
Date
Name
Owned For
Owner Type
Purchase Details
Closed on
Dec 10, 1999
Sold by
Blau Alexander S & Catalina Trust and Robert E
Bought by
Le Kim S and Lee Mei Y
Current Estimated Value
Home Financials for this Owner
Home Financials are based on the most recent Mortgage that was taken out on this home.
Original Mortgage
$175,000
Interest Rate
7.96%
Create a Home Valuation Report for This Property
The Home Valuation Report is an in-depth analysis detailing your home's value as well as a comparison with similar homes in the area
Home Values in the Area
Average Home Value in this Area
Purchase History
| Date | Buyer | Sale Price | Title Company |
|---|---|---|---|
| Le Kim S | $670,000 | First American Title Co |
Source: Public Records
Mortgage History
| Date | Status | Borrower | Loan Amount |
|---|---|---|---|
| Closed | Le Kim S | $175,000 |
Source: Public Records
Tax History Compared to Growth
Tax History
| Year | Tax Paid | Tax Assessment Tax Assessment Total Assessment is a certain percentage of the fair market value that is determined by local assessors to be the total taxable value of land and additions on the property. | Land | Improvement |
|---|---|---|---|---|
| 2025 | $3,094 | $200,655 | $32,586 | $168,069 |
| 2024 | $3,094 | $196,722 | $31,948 | $164,774 |
| 2023 | $3,037 | $192,866 | $31,322 | $161,544 |
| 2022 | $2,963 | $189,085 | $30,708 | $158,377 |
| 2021 | $2,906 | $185,378 | $30,106 | $155,272 |
| 2020 | $2,989 | $183,478 | $29,798 | $153,680 |
| 2019 | $2,843 | $179,881 | $29,214 | $150,667 |
| 2018 | $2,749 | $176,355 | $28,642 | $147,713 |
| 2017 | $2,419 | $172,898 | $28,081 | $144,817 |
| 2016 | $2,351 | $169,509 | $27,531 | $141,978 |
| 2015 | $2,320 | $166,964 | $27,118 | $139,846 |
| 2014 | $2,260 | $163,694 | $26,587 | $137,107 |
Source: Public Records
Map
Nearby Homes