Estimated Value: $207,000 - $297,000
3
Beds
2
Baths
1,167
Sq Ft
$223/Sq Ft
Est. Value
About This Home
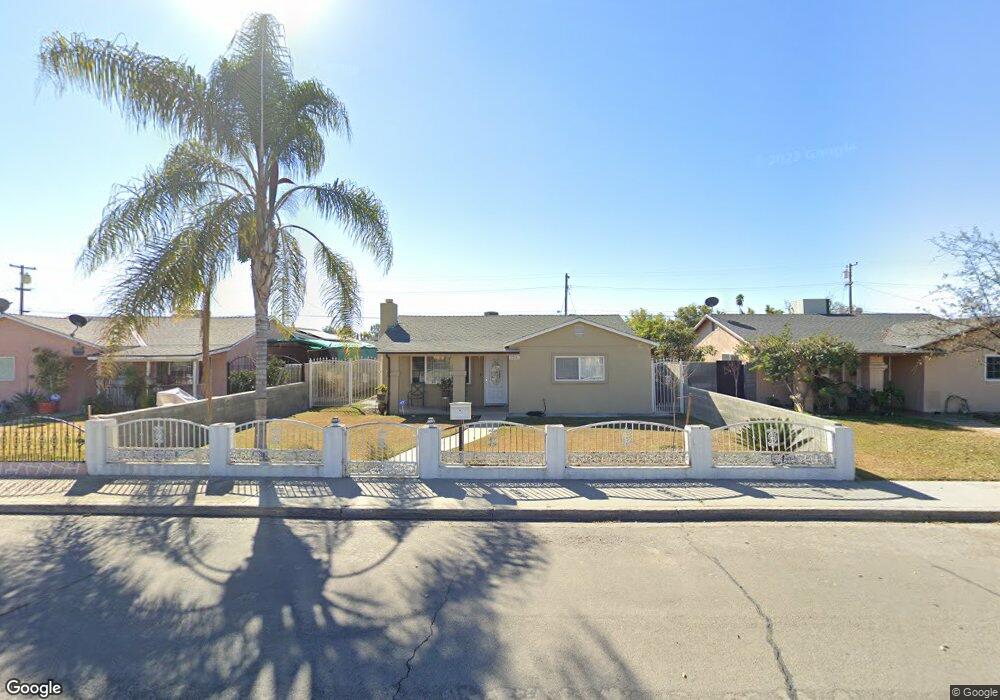
This home is located at 2201 3rd St, Wasco, CA 93280 and is currently estimated at $260,603, approximately $223 per square foot. 2201 3rd St is a home located in Kern County with nearby schools including John L. Prueitt Elementary School, Thomas Jefferson Middle School, and Wasco High School.
Ownership History
Date
Name
Owned For
Owner Type
Purchase Details
Closed on
Aug 19, 2011
Sold by
Mora Roberto and Mora Virginia
Bought by
Aguilar Octavio and Aguilar Herminia
Current Estimated Value
Purchase Details
Closed on
Jun 7, 2002
Sold by
Sierra Jesse
Bought by
Mora Roberto and Mora Virginia
Purchase Details
Closed on
Aug 20, 1999
Sold by
Sierra Maria Elena
Bought by
Sierra Jesse
Purchase Details
Closed on
Apr 20, 1999
Sold by
Sierra Manuel R
Bought by
Sierra Jesse
Create a Home Valuation Report for This Property
The Home Valuation Report is an in-depth analysis detailing your home's value as well as a comparison with similar homes in the area
Home Values in the Area
Average Home Value in this Area
Purchase History
| Date | Buyer | Sale Price | Title Company |
|---|---|---|---|
| Aguilar Octavio | -- | None Available | |
| Mora Roberto | $52,000 | Stewart Title Of Ca Inc | |
| Sierra Jesse | -- | Stewart Title Of Ca Inc | |
| Sierra Jesse | -- | Commonwealth Land Title | |
| Sierra Jesse | -- | Commonwealth Land Title |
Source: Public Records
Tax History
| Year | Tax Paid | Tax Assessment Tax Assessment Total Assessment is a certain percentage of the fair market value that is determined by local assessors to be the total taxable value of land and additions on the property. | Land | Improvement |
|---|---|---|---|---|
| 2025 | $1,138 | $76,792 | $22,147 | $54,645 |
| 2024 | $1,105 | $75,287 | $21,713 | $53,574 |
| 2023 | $1,105 | $73,812 | $21,288 | $52,524 |
| 2022 | $1,049 | $72,366 | $20,871 | $51,495 |
| 2021 | $1,017 | $70,948 | $20,462 | $50,486 |
| 2020 | $945 | $70,222 | $20,253 | $49,969 |
| 2019 | $939 | $70,222 | $20,253 | $49,969 |
| 2018 | $942 | $67,497 | $19,467 | $48,030 |
| 2017 | $919 | $66,175 | $19,086 | $47,089 |
| 2016 | $845 | $64,878 | $18,712 | $46,166 |
| 2015 | $819 | $63,904 | $18,431 | $45,473 |
| 2014 | $793 | $62,653 | $18,070 | $44,583 |
Source: Public Records
Map
Nearby Homes
- 1832 4th St
- 1622 6th St
- 625 Cedar Ave
- 2518 7th St
- 2326 Sycamore St
- 1509 5th St
- 2418 Sycamore St
- 411 Goldspire Ct
- 301 Sweetgum Ct
- 2550 Sycamore Ct
- 318 Smoke Tree Ct
- 2216 9th St
- 501 Woodside Dr
- 1903 Penelope Ave
- 1780 Ironbark St
- 2700 7th St
- 650 Oak Ave
- Lot #163 Track #1226
- 318 Adams St
- 348 Broadway St
Your Personal Tour Guide
Ask me questions while you tour the home.