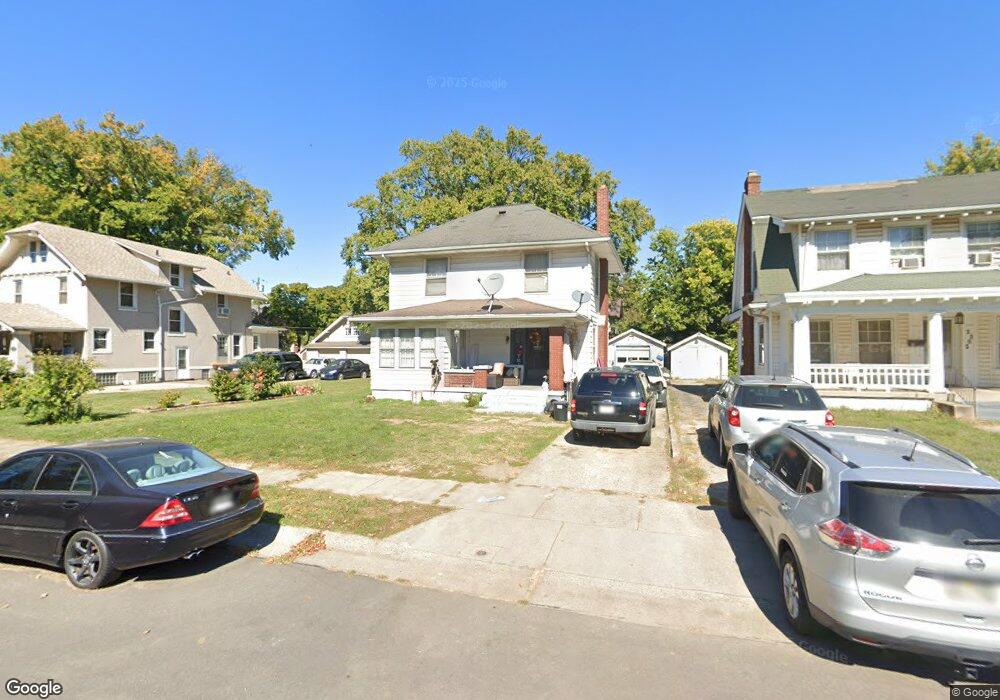
2201 Arlington Ave Middletown, OH 45044
Highlands NeighborhoodEstimated Value: $133,000 - $170,000
3
Beds
1
Bath
1,386
Sq Ft
$110/Sq Ft
Est. Value
About This Home
This home is located at 2201 Arlington Ave, Middletown, OH 45044 and is currently estimated at $152,272, approximately $109 per square foot. 2201 Arlington Ave is a home located in Butler County with nearby schools including Mayfield Elementary School, Highview 6th Grade Center, and Middletown Middle School.
Ownership History
Date
Name
Owned For
Owner Type
Purchase Details
Closed on
Nov 18, 2024
Sold by
May Zachary
Bought by
May Zachary and Jones Judy
Current Estimated Value
Purchase Details
Closed on
Nov 15, 2010
Sold by
Federal Home Loan Mortgage Corporation
Bought by
May David B
Purchase Details
Closed on
Oct 18, 2010
Sold by
Linn Michael J
Bought by
Federal Home Loan Mortgage Corp
Purchase Details
Closed on
Jun 30, 2005
Sold by
Wilson Jennifer J and Wilson Harry B
Bought by
Linn Michael J and Smith Jillian N
Home Financials for this Owner
Home Financials are based on the most recent Mortgage that was taken out on this home.
Original Mortgage
$106,500
Interest Rate
5.69%
Mortgage Type
Fannie Mae Freddie Mac
Purchase Details
Closed on
Jun 1, 1990
Create a Home Valuation Report for This Property
The Home Valuation Report is an in-depth analysis detailing your home's value as well as a comparison with similar homes in the area
Home Values in the Area
Average Home Value in this Area
Purchase History
| Date | Buyer | Sale Price | Title Company |
|---|---|---|---|
| May Zachary | -- | None Listed On Document | |
| May David B | $31,000 | Attorney | |
| Federal Home Loan Mortgage Corp | $55,400 | None Available | |
| Linn Michael J | $107,000 | -- | |
| -- | $22,000 | -- |
Source: Public Records
Mortgage History
| Date | Status | Borrower | Loan Amount |
|---|---|---|---|
| Previous Owner | Linn Michael J | $106,500 |
Source: Public Records
Tax History
| Year | Tax Paid | Tax Assessment Tax Assessment Total Assessment is a certain percentage of the fair market value that is determined by local assessors to be the total taxable value of land and additions on the property. | Land | Improvement |
|---|---|---|---|---|
| 2025 | $1,780 | $33,580 | $4,400 | $29,180 |
| 2024 | $1,780 | $33,580 | $4,400 | $29,180 |
| 2023 | $1,769 | $38,120 | $4,400 | $33,720 |
| 2022 | $1,434 | $23,480 | $4,400 | $19,080 |
| 2021 | $1,347 | $23,480 | $4,400 | $19,080 |
| 2020 | $1,403 | $23,480 | $4,400 | $19,080 |
| 2019 | $1,317 | $18,170 | $4,430 | $13,740 |
| 2018 | $1,177 | $18,170 | $4,430 | $13,740 |
| 2017 | $1,179 | $18,170 | $4,430 | $13,740 |
| 2016 | $1,062 | $16,100 | $4,430 | $11,670 |
| 2015 | $1,047 | $16,100 | $4,430 | $11,670 |
| 2014 | $2,399 | $16,100 | $4,430 | $11,670 |
| 2013 | $2,399 | $25,920 | $6,050 | $19,870 |
Source: Public Records
Map
Nearby Homes
- 2208 Linden Ave
- 2023 Arlington Ave
- 2119 Central Ave
- 19 Mckinley St
- 325 Moore St
- 2124 Sherman Ave
- 14 Moore St
- 1814.5 Logan Ave
- 2420 Superior Ave
- 113 N Sutphin St
- 102 Franklin St
- 319 Crawford St
- 409 Crawford St
- 209 Monroe St
- 501 Stanley St
- 2312 S Sutphin St
- 615 Cleveland St
- 2619 Central Ave
- 6800 Fielders Way
- 1832 Woodlawn Ave
- 2203 Arlington Ave
- 2115 Arlington Ave
- 2115 Arlington Ave
- 2205 Arlington Ave
- 2110 Linden Ave
- 2108 Linden Ave
- 2207 Arlington Ave
- 2113 Arlington Ave
- 2202 Linden Ave
- 2198 Arlington Ave
- 2204 Linden Ave
- 2209 Arlington Ave
- 2200 Arlington Ave
- 2104 Linden Ave
- 2202 Arlington Ave
- 2196 Arlington Ave
- 2204 Arlington Ave
- 2111 Arlington Ave
- 2206 Linden Ave
- 113 S Sutphin St
Your Personal Tour Guide
Ask me questions while you tour the home.