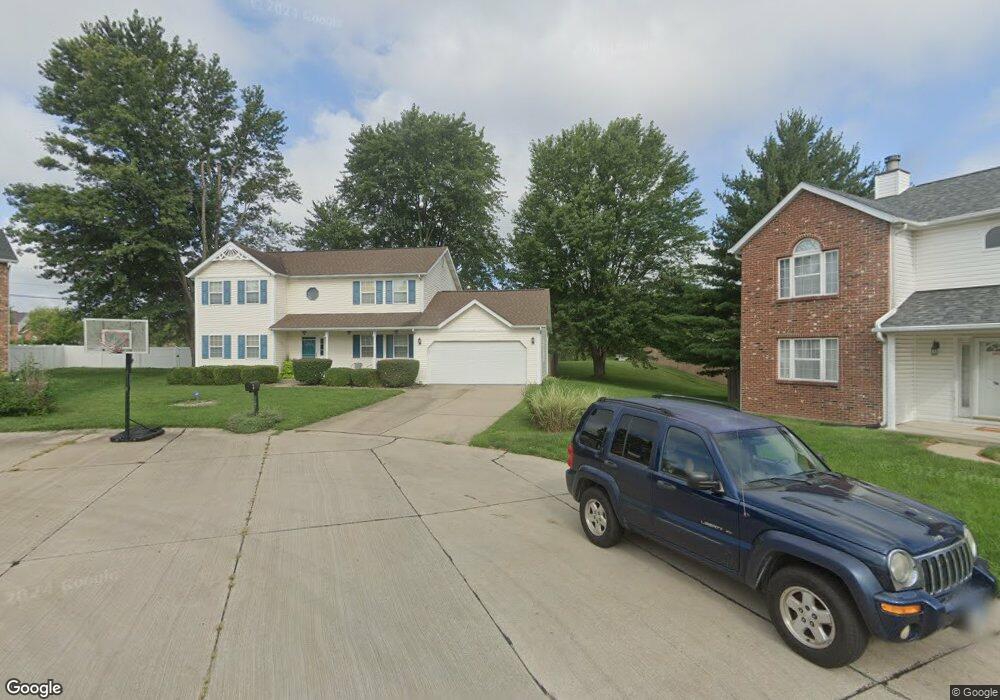
2201 Cotswold Cir Belleville, IL 62221
Estimated Value: $257,000 - $262,000
3
Beds
3
Baths
2,088
Sq Ft
$124/Sq Ft
Est. Value
About This Home
This home is located at 2201 Cotswold Cir, Belleville, IL 62221 and is currently estimated at $259,851, approximately $124 per square foot. 2201 Cotswold Cir is a home located in St. Clair County with nearby schools including Whiteside Elementary School, Whiteside Middle School, and St Teresa Catholic School.
Ownership History
Date
Name
Owned For
Owner Type
Purchase Details
Closed on
Dec 11, 2013
Sold by
Beeler Jason and Beeler Tarrah
Bought by
Lester Halisi and Lester Keya
Current Estimated Value
Home Financials for this Owner
Home Financials are based on the most recent Mortgage that was taken out on this home.
Original Mortgage
$140,883
Outstanding Balance
$106,493
Interest Rate
4.5%
Mortgage Type
FHA
Estimated Equity
$153,358
Purchase Details
Closed on
Jul 15, 2009
Sold by
Robinson Russell T and Robinson Kenya D
Bought by
Beeler Jason and Beeler Tarrah
Home Financials for this Owner
Home Financials are based on the most recent Mortgage that was taken out on this home.
Original Mortgage
$141,210
Interest Rate
5.4%
Mortgage Type
Purchase Money Mortgage
Purchase Details
Closed on
May 23, 2005
Sold by
Graham Kem E
Bought by
Robinson Russell T and Robinson Kenya D
Home Financials for this Owner
Home Financials are based on the most recent Mortgage that was taken out on this home.
Original Mortgage
$154,246
Interest Rate
6.07%
Mortgage Type
VA
Create a Home Valuation Report for This Property
The Home Valuation Report is an in-depth analysis detailing your home's value as well as a comparison with similar homes in the area
Home Values in the Area
Average Home Value in this Area
Purchase History
| Date | Buyer | Sale Price | Title Company |
|---|---|---|---|
| Lester Halisi | $144,000 | None Available | |
| Beeler Jason | $157,000 | Fatic | |
| Robinson Russell T | $151,000 | Fatic |
Source: Public Records
Mortgage History
| Date | Status | Borrower | Loan Amount |
|---|---|---|---|
| Open | Lester Halisi | $140,883 | |
| Previous Owner | Beeler Jason | $141,210 | |
| Previous Owner | Robinson Russell T | $154,246 |
Source: Public Records
Tax History Compared to Growth
Tax History
| Year | Tax Paid | Tax Assessment Tax Assessment Total Assessment is a certain percentage of the fair market value that is determined by local assessors to be the total taxable value of land and additions on the property. | Land | Improvement |
|---|---|---|---|---|
| 2024 | $4,486 | $72,764 | $18,116 | $54,648 |
| 2023 | $4,305 | $68,411 | $17,867 | $50,544 |
| 2022 | $3,704 | $62,305 | $16,272 | $46,033 |
| 2021 | $3,617 | $59,748 | $15,604 | $44,144 |
| 2020 | $3,482 | $55,641 | $14,531 | $41,110 |
| 2019 | $3,406 | $56,293 | $14,829 | $41,464 |
| 2018 | $3,328 | $54,855 | $14,450 | $40,405 |
| 2017 | $3,354 | $53,395 | $14,066 | $39,329 |
| 2016 | $3,338 | $51,554 | $13,581 | $37,973 |
| 2014 | $3,136 | $52,641 | $13,098 | $39,543 |
| 2013 | $3,296 | $52,641 | $13,098 | $39,543 |
Source: Public Records
Map
Nearby Homes
- 2224 Cotswold Cir
- 2237 Glenfield Dr
- 2290 Wellington Dr
- 313 Radcliff Rd
- 713 Oxen Dr
- 21 Raven Oak Dr
- 714 Oxen Dr
- 612 Westfield Ct
- 517 E Waters Edge Dr
- 520 Country Meadow Ln
- 2336 Greenfield Dr
- 2333 Greenfield Dr
- 0 Hartman Ln
- 1278 Bainbridge Ct
- 651 Glen Mor
- 1232 Carleton Ln
- 220 Country Meadow Ln
- 2605 Cheyenne Wells Dr
- 2604 Windsor Crest Ct
- Whitney Plan at Greystone Estates
- 2205 Cotswold Cir
- 2200 Cotswold Cir
- 2204 Ellington Dr
- 2209 Cotswold Cir
- 2208 Ellington Dr
- 2208 Cotswold Cir
- 2213 Cotswold Cir
- 2201 Richland Prairie Blvd
- 2203 Richland Prairie Blvd
- 2205 Richland Prairie Blvd
- 2207 Richland Prairie Blvd
- 2212 Ellington Dr
- 2201 Ellington Dr
- 2212 Cotswold Cir
- 2209 Richland Prairie Blvd
- 2217 Cotswold Cir
- 800 Penhurst Place
- 2216 Ellington Dr
- 2216 Cotswold Cir
- 2213 Richland Prairie Blvd