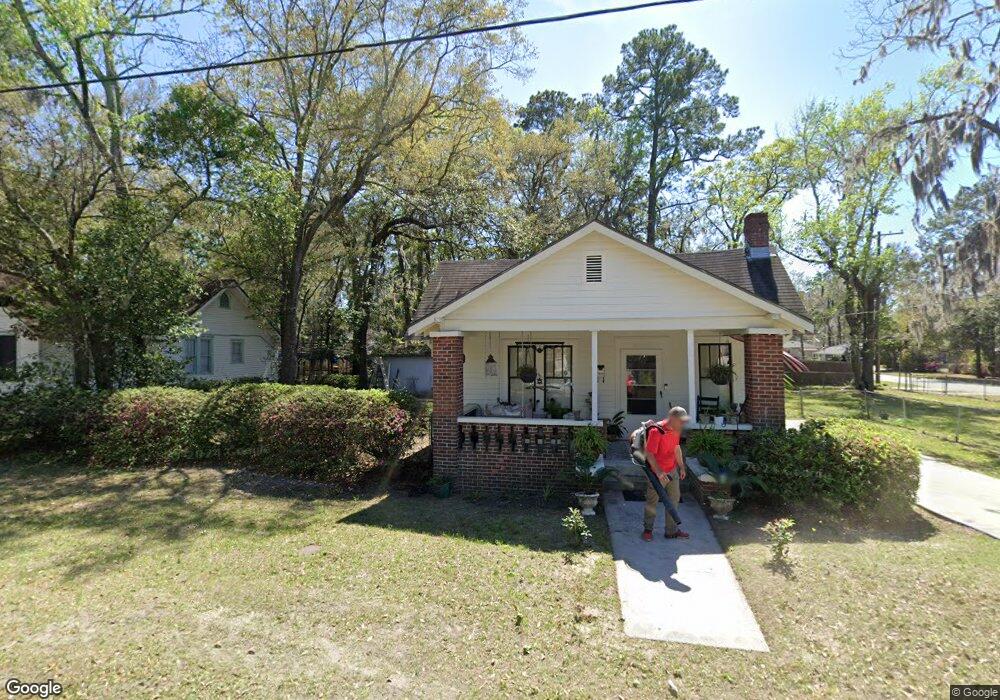
2201 Delesseps Ave Savannah, GA 31404
LaRoche Park-Springhill-Daffin Heights NeighborhoodEstimated Value: $190,000 - $204,161
2
Beds
1
Bath
988
Sq Ft
$198/Sq Ft
Est. Value
About This Home
This home is located at 2201 Delesseps Ave, Savannah, GA 31404 and is currently estimated at $195,290, approximately $197 per square foot. 2201 Delesseps Ave is a home located in Chatham County with nearby schools including Myers Middle School, Jenkins High School, and Calvary Day School.
Ownership History
Date
Name
Owned For
Owner Type
Purchase Details
Closed on
Jun 30, 2025
Sold by
Ballard Hannah Lee
Bought by
Ballard Homes & Properties Llc
Current Estimated Value
Home Financials for this Owner
Home Financials are based on the most recent Mortgage that was taken out on this home.
Original Mortgage
$153,600
Outstanding Balance
$153,342
Interest Rate
6.89%
Mortgage Type
New Conventional
Estimated Equity
$41,948
Purchase Details
Closed on
Jun 20, 2025
Sold by
Francis Courtney
Bought by
Ballard Hannah Lee and Ballard Matthew Leon
Home Financials for this Owner
Home Financials are based on the most recent Mortgage that was taken out on this home.
Original Mortgage
$153,600
Outstanding Balance
$153,342
Interest Rate
6.89%
Mortgage Type
New Conventional
Estimated Equity
$41,948
Purchase Details
Closed on
May 20, 2022
Sold by
Carlson Hilda F
Bought by
Francis Courtney
Create a Home Valuation Report for This Property
The Home Valuation Report is an in-depth analysis detailing your home's value as well as a comparison with similar homes in the area
Home Values in the Area
Average Home Value in this Area
Purchase History
| Date | Buyer | Sale Price | Title Company |
|---|---|---|---|
| Ballard Homes & Properties Llc | -- | -- | |
| Ballard Hannah Lee | $192,000 | -- | |
| Francis Courtney | $105,000 | -- |
Source: Public Records
Mortgage History
| Date | Status | Borrower | Loan Amount |
|---|---|---|---|
| Open | Ballard Homes & Properties Llc | $153,600 |
Source: Public Records
Tax History Compared to Growth
Tax History
| Year | Tax Paid | Tax Assessment Tax Assessment Total Assessment is a certain percentage of the fair market value that is determined by local assessors to be the total taxable value of land and additions on the property. | Land | Improvement |
|---|---|---|---|---|
| 2025 | $562 | $57,560 | $21,000 | $36,560 |
| 2024 | $562 | $50,600 | $21,000 | $29,600 |
| 2023 | $468 | $48,160 | $13,760 | $34,400 |
| 2022 | $794 | $38,520 | $13,760 | $24,760 |
| 2021 | $1,112 | $25,760 | $6,240 | $19,520 |
| 2020 | $841 | $25,800 | $6,240 | $19,560 |
| 2019 | $1,184 | $26,640 | $6,240 | $20,400 |
| 2018 | $597 | $18,920 | $6,240 | $12,680 |
| 2017 | $568 | $19,360 | $6,240 | $13,120 |
| 2016 | $562 | $19,280 | $6,240 | $13,040 |
| 2015 | $771 | $18,480 | $6,320 | $12,160 |
| 2014 | $1,065 | $18,960 | $0 | $0 |
Source: Public Records
Map
Nearby Homes
- 2044 E 60th St
- 1918 E 63rd St
- 2009 E 57th St
- 2110 E 56th St
- 1818 E 60th St
- 2309 Lorraine Dr
- 2223 Armstrong Dr
- 1907 E 64th St
- 2237 Mason Dr
- 2338 Lorraine Dr
- 2208 Lorraine Ct
- 2004 N Fernwood Dr
- 2207 Mason Dr
- 128 Walz Cir
- 55 S Parkwood Dr
- 113 Walz Cir
- 1523 E 54th St
- 2327 Toussaint Ave
- 2221 Walz Dr
- 2332 Walz Dr
- 2203 Delesseps Ave
- 2203 Delesseps Ave
- 2203 Delesseps Ave Unit B
- 2203 Delesseps Ave Unit A
- 2203 Delesseps Ave Unit B
- 2202 Delesseps Ave
- 2204 Delesseps Ave
- 2204 Delesseps Ave
- 2200 E 59th St
- 2205 Delesseps Ave
- 2210 Delesseps Ave
- 2202 E 59th St
- 2119 Delesseps Ave
- 2210 E 59th St
- 2120 Delesseps Ave
- 2122 E 59th St
- 2214 E 59th St
- 2218 Delesseps Ave
- 2215 Delesseps Ave
- 2115 Delesseps Ave