Estimated Value: $608,244
Studio
--
Bath
3,630
Sq Ft
$168/Sq Ft
Est. Value
About This Home
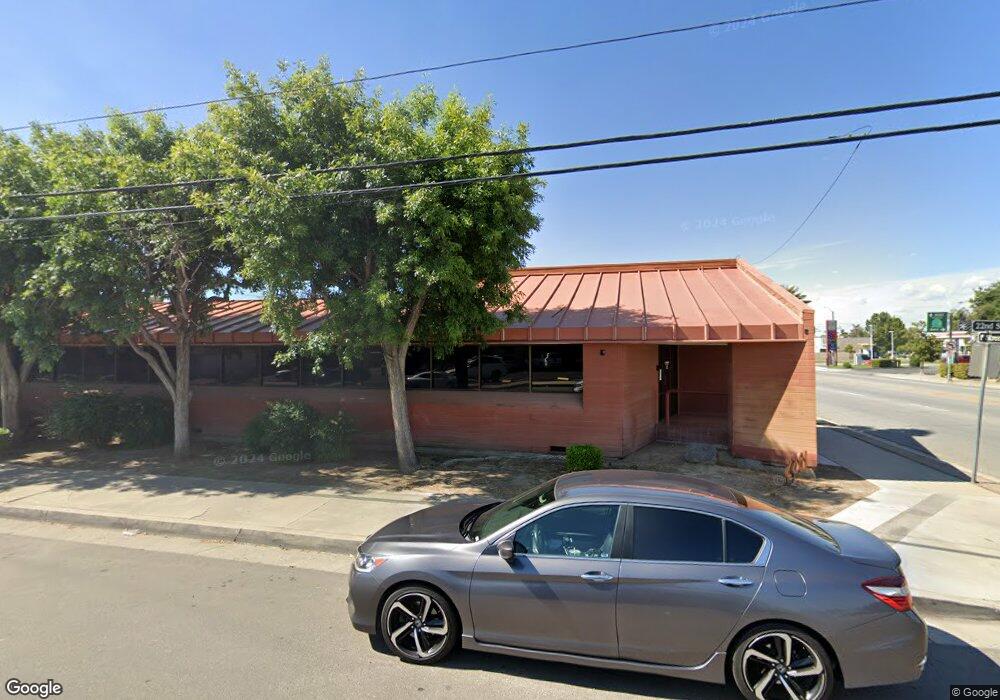
This home is located at 2201 F St, Bakersfield, CA 93301 and is currently estimated at $608,244, approximately $167 per square foot. 2201 F St is a home located in Kern County with nearby schools including Franklin Elementary School, Emerson Middle School, and Bakersfield High School.
Ownership History
Date
Name
Owned For
Owner Type
Purchase Details
Closed on
Oct 26, 2017
Sold by
E & B Natural Resourses Management Corpora
Bought by
Elison Sally E and The Etison Family Trust
Current Estimated Value
Purchase Details
Closed on
Oct 25, 2017
Sold by
Elison Sally E and The Elison Family Trust
Bought by
Slykerman Kelly
Purchase Details
Closed on
Jun 18, 1997
Sold by
Elison James H and Elison Sally E
Bought by
Elison James H and Elison Sally E
Purchase Details
Closed on
May 4, 1994
Sold by
Saunders Park Villa
Bought by
Elison James H
Create a Home Valuation Report for This Property
The Home Valuation Report is an in-depth analysis detailing your home's value as well as a comparison with similar homes in the area
Home Values in the Area
Average Home Value in this Area
Purchase History
| Date | Buyer | Sale Price | Title Company |
|---|---|---|---|
| Elison Sally E | -- | Ticor Title Company | |
| Slykerman Kelly | $350,000 | Ticor Title Company | |
| Elison James H | -- | -- | |
| Elison James H | $5,000 | Stewart Title |
Source: Public Records
Tax History
| Year | Tax Paid | Tax Assessment Tax Assessment Total Assessment is a certain percentage of the fair market value that is determined by local assessors to be the total taxable value of land and additions on the property. | Land | Improvement |
|---|---|---|---|---|
| 2025 | $4,836 | $398,235 | $130,848 | $267,387 |
| 2024 | $4,749 | $390,428 | $128,283 | $262,145 |
| 2023 | $4,749 | $382,773 | $125,768 | $257,005 |
| 2022 | $4,676 | $375,268 | $123,302 | $251,966 |
| 2021 | $4,625 | $367,911 | $120,885 | $247,026 |
| 2020 | $4,616 | $364,140 | $119,646 | $244,494 |
| 2019 | $4,527 | $364,140 | $119,646 | $244,494 |
| 2018 | $4,419 | $350,000 | $115,000 | $235,000 |
| 2017 | $4,454 | $347,191 | $91,939 | $255,252 |
| 2016 | $4,023 | $340,385 | $90,137 | $250,248 |
| 2015 | $4,013 | $335,274 | $88,784 | $246,490 |
| 2014 | $3,881 | $328,707 | $87,045 | $241,662 |
Source: Public Records
Map
Nearby Homes
Your Personal Tour Guide
Ask me questions while you tour the home.