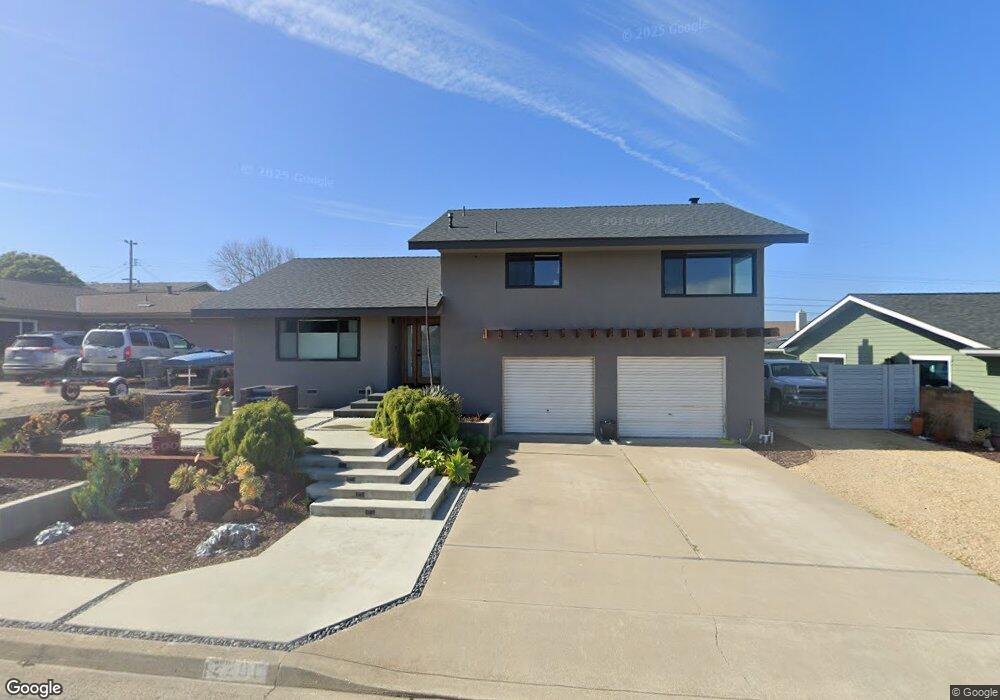
2201 Fresno St Los Osos, CA 93402
Estimated Value: $979,899 - $1,097,000
2
Beds
3
Baths
1,776
Sq Ft
$588/Sq Ft
Est. Value
About This Home
This home is located at 2201 Fresno St, Los Osos, CA 93402 and is currently estimated at $1,043,475, approximately $587 per square foot. 2201 Fresno St is a home located in San Luis Obispo County with nearby schools including Monarch Grove Elementary School, Los Osos Middle School, and Morro Bay High School.
Ownership History
Date
Name
Owned For
Owner Type
Purchase Details
Closed on
Jan 20, 2010
Sold by
Gordon Wanda Lee and Ley Cecile Diane
Bought by
Gifford Ryan and Keegan Josalyn
Current Estimated Value
Home Financials for this Owner
Home Financials are based on the most recent Mortgage that was taken out on this home.
Original Mortgage
$312,000
Outstanding Balance
$205,676
Interest Rate
5.03%
Mortgage Type
New Conventional
Estimated Equity
$837,799
Purchase Details
Closed on
Jul 17, 2008
Sold by
Gordon Norvin
Bought by
Gordon Wanda Lee
Purchase Details
Closed on
Jul 9, 2008
Sold by
Ley Cecile Diane and Mary F Lenderman Living Trust
Bought by
Gordon Wanda Lee and Ley Cecile Diane
Purchase Details
Closed on
Oct 1, 2003
Sold by
Lenderman Mary F
Bought by
Lenderman Mary F and The Mary F Lenderman Living Tr
Create a Home Valuation Report for This Property
The Home Valuation Report is an in-depth analysis detailing your home's value as well as a comparison with similar homes in the area
Home Values in the Area
Average Home Value in this Area
Purchase History
| Date | Buyer | Sale Price | Title Company |
|---|---|---|---|
| Gifford Ryan | $390,000 | Fidelity National Title Co | |
| Gordon Wanda Lee | -- | Accommodation | |
| Segelke Monnie Lenderman | -- | Accommodation | |
| Gordon Wanda Lee | -- | Accommodation | |
| Lenderman Mary F | -- | -- |
Source: Public Records
Mortgage History
| Date | Status | Borrower | Loan Amount |
|---|---|---|---|
| Open | Gifford Ryan | $312,000 |
Source: Public Records
Tax History Compared to Growth
Tax History
| Year | Tax Paid | Tax Assessment Tax Assessment Total Assessment is a certain percentage of the fair market value that is determined by local assessors to be the total taxable value of land and additions on the property. | Land | Improvement |
|---|---|---|---|---|
| 2025 | $7,924 | $503,404 | $225,885 | $277,519 |
| 2024 | $7,782 | $493,534 | $221,456 | $272,078 |
| 2023 | $7,782 | $483,858 | $217,114 | $266,744 |
| 2022 | $7,355 | $474,371 | $212,857 | $261,514 |
| 2021 | $7,212 | $465,071 | $208,684 | $256,387 |
| 2020 | $6,957 | $460,304 | $206,545 | $253,759 |
| 2019 | $6,902 | $451,280 | $202,496 | $248,784 |
| 2018 | $6,847 | $442,432 | $198,526 | $243,906 |
| 2017 | $6,650 | $433,758 | $194,634 | $239,124 |
| 2016 | $5,299 | $425,254 | $190,818 | $234,436 |
| 2015 | $5,228 | $418,867 | $187,952 | $230,915 |
| 2014 | $4,862 | $410,663 | $184,271 | $226,392 |
Source: Public Records
Map
Nearby Homes