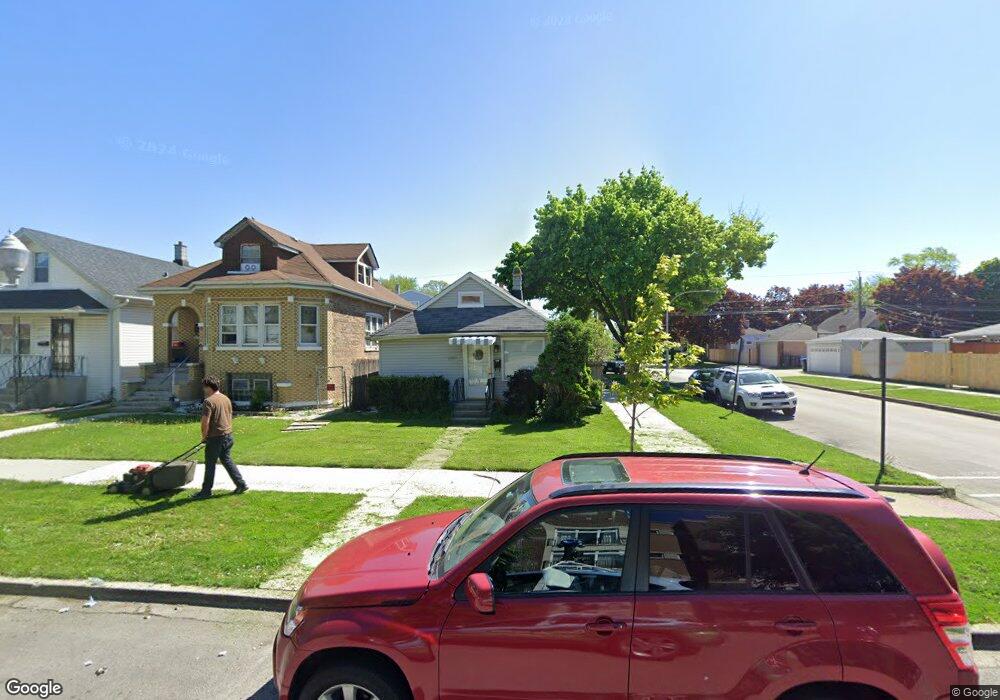
2201 N Natchez Ave Chicago, IL 60707
Galewood NeighborhoodEstimated Value: $258,000 - $295,296
3
Beds
1
Bath
969
Sq Ft
$291/Sq Ft
Est. Value
About This Home
This home is located at 2201 N Natchez Ave, Chicago, IL 60707 and is currently estimated at $281,574, approximately $290 per square foot. 2201 N Natchez Ave is a home located in Cook County with nearby schools including Burbank Elementary School, Steinmetz College Prep, and Acero - Roberto Clemente Elementary School.
Ownership History
Date
Name
Owned For
Owner Type
Purchase Details
Closed on
Aug 15, 2001
Sold by
Danilkowicz Anna
Bought by
Dizon Gener T
Current Estimated Value
Home Financials for this Owner
Home Financials are based on the most recent Mortgage that was taken out on this home.
Original Mortgage
$141,550
Outstanding Balance
$59,582
Interest Rate
8.25%
Estimated Equity
$221,992
Purchase Details
Closed on
Apr 2, 2001
Sold by
Hud
Bought by
Danilkowicz Anna
Home Financials for this Owner
Home Financials are based on the most recent Mortgage that was taken out on this home.
Original Mortgage
$76,000
Interest Rate
6.99%
Purchase Details
Closed on
Sep 22, 2000
Sold by
Lewis Wendell
Bought by
Hud
Purchase Details
Closed on
Dec 1, 1993
Sold by
Vida Celedonio A and Vida Evelyn P
Bought by
Lewis Wendell and Lewis Cynthia
Home Financials for this Owner
Home Financials are based on the most recent Mortgage that was taken out on this home.
Original Mortgage
$75,190
Interest Rate
7.26%
Mortgage Type
FHA
Create a Home Valuation Report for This Property
The Home Valuation Report is an in-depth analysis detailing your home's value as well as a comparison with similar homes in the area
Home Values in the Area
Average Home Value in this Area
Purchase History
| Date | Buyer | Sale Price | Title Company |
|---|---|---|---|
| Dizon Gener T | $149,000 | Stewart Title | |
| Danilkowicz Anna | -- | Stewart Title Company | |
| Hud | -- | -- | |
| Lewis Wendell | $50,000 | -- |
Source: Public Records
Mortgage History
| Date | Status | Borrower | Loan Amount |
|---|---|---|---|
| Open | Dizon Gener T | $141,550 | |
| Previous Owner | Danilkowicz Anna | $76,000 | |
| Previous Owner | Lewis Wendell | $75,190 | |
| Closed | Danilkowicz Anna | $76,000 |
Source: Public Records
Tax History Compared to Growth
Tax History
| Year | Tax Paid | Tax Assessment Tax Assessment Total Assessment is a certain percentage of the fair market value that is determined by local assessors to be the total taxable value of land and additions on the property. | Land | Improvement |
|---|---|---|---|---|
| 2024 | $3,100 | $20,000 | $6,993 | $13,007 |
| 2023 | $3,001 | $18,000 | $5,670 | $12,330 |
| 2022 | $3,001 | $18,000 | $5,670 | $12,330 |
| 2021 | $2,952 | $18,000 | $5,670 | $12,330 |
| 2020 | $2,930 | $16,246 | $4,725 | $11,521 |
| 2019 | $2,980 | $18,254 | $4,725 | $13,529 |
| 2018 | $2,929 | $18,254 | $4,725 | $13,529 |
| 2017 | $3,168 | $18,086 | $4,158 | $13,928 |
| 2016 | $3,124 | $18,086 | $4,158 | $13,928 |
| 2015 | $2,835 | $18,086 | $4,158 | $13,928 |
| 2014 | $2,863 | $17,987 | $3,780 | $14,207 |
| 2013 | $2,795 | $17,987 | $3,780 | $14,207 |
Source: Public Records
Map
Nearby Homes
- 2311 N Natchez Ave
- 2317 N Natchez Ave
- 2044 N Narragansett Ave
- 2328 N Normandy Ave
- 2335 N Merrimac Ave
- 1937 N Normandy Ave
- 2430 N Normandy Ave
- 2048 N Oak Park Ave
- 1916 N Rutherford Ave
- 2119 N Mcvicker Ave
- 1941 N New England Ave
- 2123 N Austin Ave
- 2554 N Oak Park Ave
- 2612 N Moody Ave
- 1700 N Natoma Ave
- 2601 N Moody Ave
- 1733 N Oak Park Ave
- 2724 N Mobile Ave
- 1627 N Narragansett Ave
- 2536 N Austin Ave
- 2205 N Natchez Ave
- 2207 N Natchez Ave
- 2211 N Natchez Ave
- 2159 N Natchez Ave
- 2213 N Natchez Ave
- 2155 N Natchez Ave
- 2204 N Nagle Ave Unit 2
- 2204 N Nagle Ave
- 2204 N Nagle Ave Unit 1
- 2206 N Nagle Ave
- 2217 N Natchez Ave
- 2151 N Natchez Ave
- 2210 N Nagle Ave
- 2158 N Nagle Ave
- 2204 N Natchez Ave Unit 2N
- 2204 N Natchez Ave Unit 2S
- 2204 N Natchez Ave Unit 1S
- 2204 N Natchez Ave Unit 1N
- 2204 N Natchez Ave Unit 3N