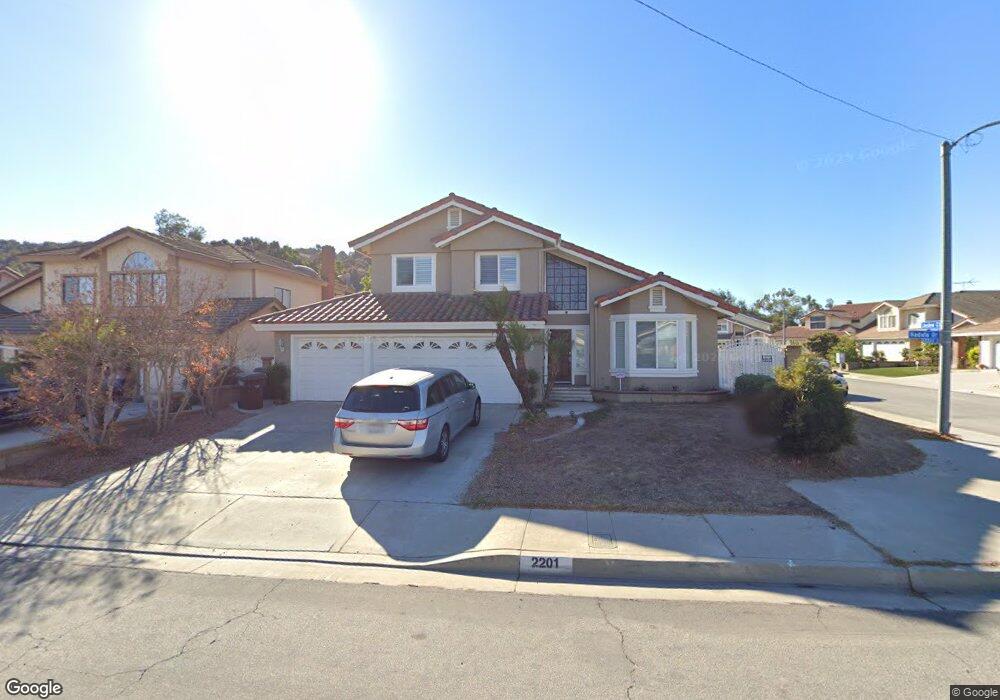
2201 Nadula Dr Hacienda Heights, CA 91745
Estimated Value: $1,024,148 - $1,144,000
3
Beds
3
Baths
1,939
Sq Ft
$562/Sq Ft
Est. Value
About This Home
This home is located at 2201 Nadula Dr, Hacienda Heights, CA 91745 and is currently estimated at $1,090,037, approximately $562 per square foot. 2201 Nadula Dr is a home located in Los Angeles County with nearby schools including Wedgeworth Elementary School, Glen A. Wilson High School, and Molokan Elementary School.
Ownership History
Date
Name
Owned For
Owner Type
Purchase Details
Closed on
Aug 13, 2022
Sold by
Du John and Du Josephine
Bought by
Du Family Living Trust
Current Estimated Value
Purchase Details
Closed on
Sep 23, 2011
Sold by
Kim John
Bought by
Du John and Du Josephine
Home Financials for this Owner
Home Financials are based on the most recent Mortgage that was taken out on this home.
Original Mortgage
$375,000
Interest Rate
3.37%
Mortgage Type
New Conventional
Purchase Details
Closed on
Oct 31, 2003
Sold by
Kim Ok Sun
Bought by
Kim John
Home Financials for this Owner
Home Financials are based on the most recent Mortgage that was taken out on this home.
Original Mortgage
$322,700
Interest Rate
5.92%
Mortgage Type
Purchase Money Mortgage
Purchase Details
Closed on
Mar 30, 1999
Sold by
Kim Ji Lim and Kim Kyu S
Bought by
Kim Ok Sun
Home Financials for this Owner
Home Financials are based on the most recent Mortgage that was taken out on this home.
Original Mortgage
$201,600
Interest Rate
6.98%
Create a Home Valuation Report for This Property
The Home Valuation Report is an in-depth analysis detailing your home's value as well as a comparison with similar homes in the area
Home Values in the Area
Average Home Value in this Area
Purchase History
| Date | Buyer | Sale Price | Title Company |
|---|---|---|---|
| Du Family Living Trust | -- | -- | |
| Du John | $500,000 | Chicago Title Co | |
| Kim John | $449,000 | Chicago Title Co | |
| Kim Ok Sun | $288,000 | South Coast Title |
Source: Public Records
Mortgage History
| Date | Status | Borrower | Loan Amount |
|---|---|---|---|
| Previous Owner | Du John | $375,000 | |
| Previous Owner | Kim John | $322,700 | |
| Previous Owner | Kim Ok Sun | $201,600 | |
| Closed | Kim John | $100,000 |
Source: Public Records
Tax History Compared to Growth
Tax History
| Year | Tax Paid | Tax Assessment Tax Assessment Total Assessment is a certain percentage of the fair market value that is determined by local assessors to be the total taxable value of land and additions on the property. | Land | Improvement |
|---|---|---|---|---|
| 2025 | $7,768 | $628,014 | $275,570 | $352,444 |
| 2024 | $7,768 | $615,701 | $270,167 | $345,534 |
| 2023 | $7,475 | $603,629 | $264,870 | $338,759 |
| 2022 | $7,250 | $591,794 | $259,677 | $332,117 |
| 2021 | $7,116 | $580,191 | $254,586 | $325,605 |
| 2019 | $6,905 | $562,985 | $247,036 | $315,949 |
| 2018 | $6,702 | $551,947 | $242,193 | $309,754 |
| 2016 | $6,213 | $530,517 | $232,790 | $297,727 |
| 2015 | $6,161 | $522,549 | $229,294 | $293,255 |
| 2014 | $6,057 | $512,314 | $224,803 | $287,511 |
Source: Public Records
Map
Nearby Homes
- 17070 Colima Rd Unit 284
- 16978 Colchester Way Unit 140
- 2521 Mountainview Ct
- 2367 Mountain Brook Dr
- 1804 Ewing Ct
- 17712 Nearbank Dr
- 1807 Avenida Del Canada
- 1948 Calle Bogota
- 1607 Waverly Glen Way
- 2048 Calle Bogota
- 17834 Calle Los Arboles
- 1507 Eagle Park Rd
- 16907 Ridge Park Dr
- 16500 Ember Glen Rd
- 2021 Elderway Dr
- 2330 Donosa Dr
- 1440 Forest Glen Dr
- 2503 Donosa Dr
- 1740 Rada Rd
- 1469 Forest Glen Dr Unit 193