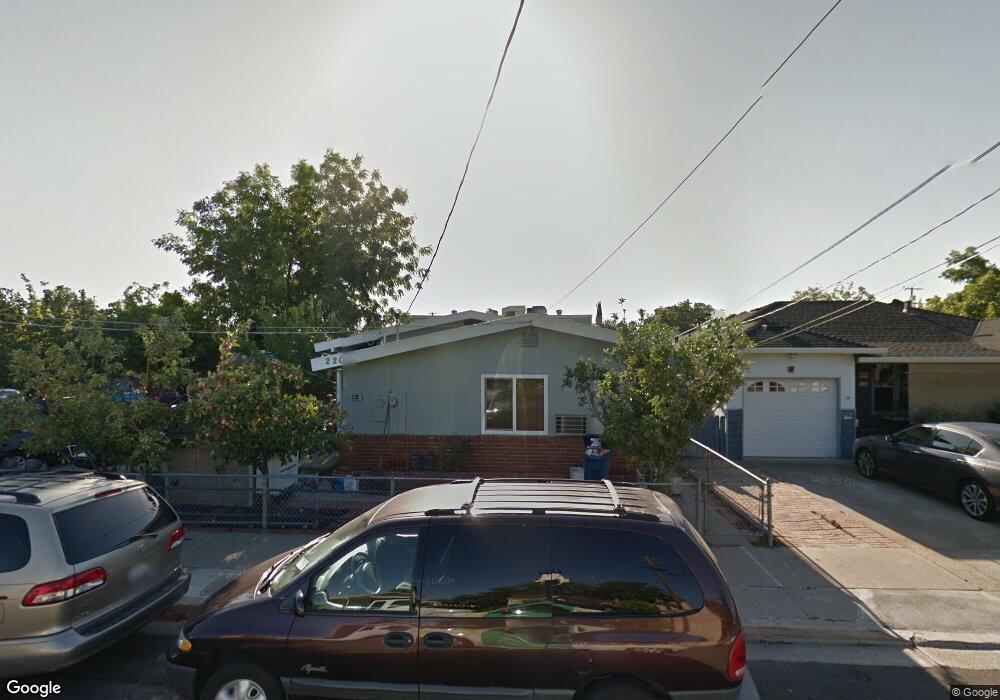
2201 Norton Way Antioch, CA 94509
North Antioch NeighborhoodEstimated Value: $418,000 - $444,000
3
Beds
1
Bath
1,026
Sq Ft
$424/Sq Ft
Est. Value
About This Home
This home is located at 2201 Norton Way, Antioch, CA 94509 and is currently estimated at $435,281, approximately $424 per square foot. 2201 Norton Way is a home located in Contra Costa County with nearby schools including Marsh Elementary School, Antioch Middle School, and Antioch High School.
Ownership History
Date
Name
Owned For
Owner Type
Purchase Details
Closed on
Feb 12, 2020
Sold by
Knoblich Gregory J and Gregory J Knoblich 2008 Trust
Bought by
Knoblich Sotiria E and Knoblich Survivors Trust
Current Estimated Value
Purchase Details
Closed on
Dec 12, 2019
Sold by
Krkabob Incorporated
Bought by
Knoblich Gregory J
Home Financials for this Owner
Home Financials are based on the most recent Mortgage that was taken out on this home.
Original Mortgage
$256,000
Interest Rate
3.6%
Mortgage Type
New Conventional
Purchase Details
Closed on
Dec 22, 2012
Sold by
Knoblich Gregory J
Bought by
Krkabob Incorporated
Purchase Details
Closed on
Oct 3, 2011
Sold by
Peirson Kristina M
Bought by
Knoblich Gregory J
Purchase Details
Closed on
May 10, 2011
Sold by
Wells Fargo Bank Na
Bought by
Peirson Kristina M
Purchase Details
Closed on
Oct 11, 2005
Sold by
Wells Fargo Bank N A
Bought by
Wells Fargo Bank N A
Purchase Details
Closed on
Jun 11, 2003
Sold by
Wells Fargo Bank Na
Bought by
Wells Fargo Bank Na
Create a Home Valuation Report for This Property
The Home Valuation Report is an in-depth analysis detailing your home's value as well as a comparison with similar homes in the area
Home Values in the Area
Average Home Value in this Area
Purchase History
| Date | Buyer | Sale Price | Title Company |
|---|---|---|---|
| Knoblich Sotiria E | -- | None Available | |
| Knoblich Gregory J | -- | Westminster Title Co Inc | |
| Krkabob Incorporated | $159,000 | None Available | |
| Knoblich Gregory J | $105,500 | Old Republic Title Company | |
| Peirson Kristina M | -- | None Available | |
| Wells Fargo Bank N A | -- | -- | |
| Wells Fargo Bank Na | -- | -- |
Source: Public Records
Mortgage History
| Date | Status | Borrower | Loan Amount |
|---|---|---|---|
| Closed | Knoblich Gregory J | $256,000 |
Source: Public Records
Tax History
| Year | Tax Paid | Tax Assessment Tax Assessment Total Assessment is a certain percentage of the fair market value that is determined by local assessors to be the total taxable value of land and additions on the property. | Land | Improvement |
|---|---|---|---|---|
| 2025 | $4,788 | $377,303 | $240,600 | $136,703 |
| 2024 | $4,623 | $369,906 | $235,883 | $134,023 |
| 2023 | $4,623 | $369,342 | $234,090 | $135,252 |
| 2022 | $4,479 | $355,544 | $226,724 | $128,820 |
| 2021 | $4,303 | $348,574 | $222,279 | $126,295 |
| 2019 | $2,421 | $175,514 | $68,163 | $107,351 |
| 2018 | $2,335 | $172,074 | $66,827 | $105,247 |
| 2017 | $2,272 | $168,701 | $65,517 | $103,184 |
| 2016 | $2,211 | $165,394 | $64,233 | $101,161 |
| 2015 | $2,185 | $162,911 | $63,269 | $99,642 |
| 2014 | $2,117 | $159,721 | $62,030 | $97,691 |
Source: Public Records
Map
Nearby Homes
- 2205 Norton Way
- 18 W Madill St
- 18 W Madill St
- 12 W Madill St
- 12 W Madill St
- 2204 Norton Way
- 2200 Norton Way
- 28 W Madill St
- 6 Madill Ct
- 6 W Madill St
- 32 W Madill St
- 2201 Lindberg St
- 2205 Lindberg St
- 2113 Lindberg St
- 19 W Madill St
- 19 W Madill St
- 15 W Madill St
- 15 W Madill St
- 23 W Madill St
- 23 W Madill St
Your Personal Tour Guide
Ask me questions while you tour the home.