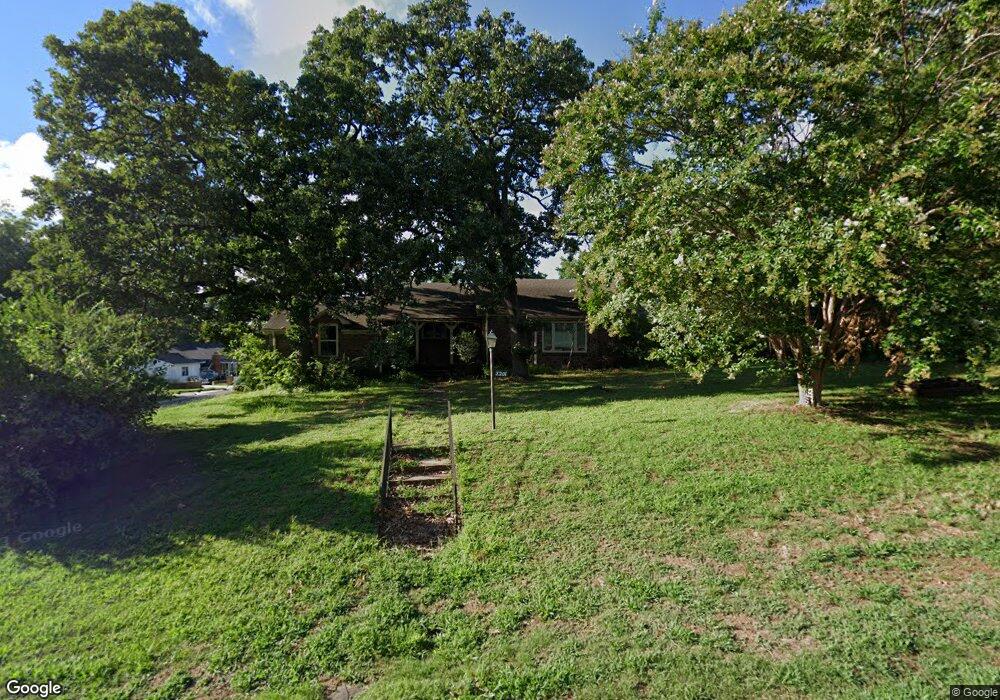
2201 S Q St Fort Smith, AR 72901
Park Hill NeighborhoodEstimated Value: $192,000 - $222,000
--
Bed
2
Baths
1,670
Sq Ft
$123/Sq Ft
Est. Value
About This Home
This home is located at 2201 S Q St, Fort Smith, AR 72901 and is currently estimated at $205,421, approximately $123 per square foot. 2201 S Q St is a home located in Sebastian County with nearby schools including Ballman Elementary School, William O. Darby Junior High School, and Northside High School.
Ownership History
Date
Name
Owned For
Owner Type
Purchase Details
Closed on
Dec 12, 2011
Sold by
Copher Michael T
Bought by
Daniel Tom W and Daniel Carole B
Current Estimated Value
Purchase Details
Closed on
Dec 6, 1993
Bought by
Hurst Carolyn Wallace Trust
Purchase Details
Closed on
Nov 30, 1993
Bought by
King King R and King Kathy M
Purchase Details
Closed on
Oct 31, 1990
Bought by
Cowan Ralph J Trustee
Purchase Details
Closed on
Mar 4, 1988
Bought by
Cowan Ralph J and Cowan Gladys L
Purchase Details
Closed on
Aug 18, 1987
Bought by
Labahn Edna
Create a Home Valuation Report for This Property
The Home Valuation Report is an in-depth analysis detailing your home's value as well as a comparison with similar homes in the area
Home Values in the Area
Average Home Value in this Area
Purchase History
| Date | Buyer | Sale Price | Title Company |
|---|---|---|---|
| Daniel Tom W | $110,000 | None Available | |
| Hurst Carolyn Wallace Trust | $78,000 | -- | |
| King King R | -- | -- | |
| Cowan Ralph J Trustee | -- | -- | |
| Cowan Ralph J | $60,000 | -- | |
| Labahn Edna | -- | -- |
Source: Public Records
Tax History Compared to Growth
Tax History
| Year | Tax Paid | Tax Assessment Tax Assessment Total Assessment is a certain percentage of the fair market value that is determined by local assessors to be the total taxable value of land and additions on the property. | Land | Improvement |
|---|---|---|---|---|
| 2024 | $1,445 | $27,520 | $6,500 | $21,020 |
| 2023 | $1,598 | $27,520 | $6,500 | $21,020 |
| 2022 | $1,598 | $27,520 | $6,500 | $21,020 |
| 2021 | $1,598 | $27,520 | $6,500 | $21,020 |
| 2020 | $1,598 | $27,520 | $6,500 | $21,020 |
| 2019 | $1,333 | $22,960 | $5,500 | $17,460 |
| 2018 | $1,333 | $22,960 | $5,500 | $17,460 |
| 2017 | $1,205 | $22,960 | $5,500 | $17,460 |
| 2016 | $1,205 | $22,960 | $5,500 | $17,460 |
| 2015 | $1,205 | $22,960 | $5,500 | $17,460 |
| 2014 | $1,253 | $23,860 | $3,600 | $20,260 |
Source: Public Records
Map
Nearby Homes