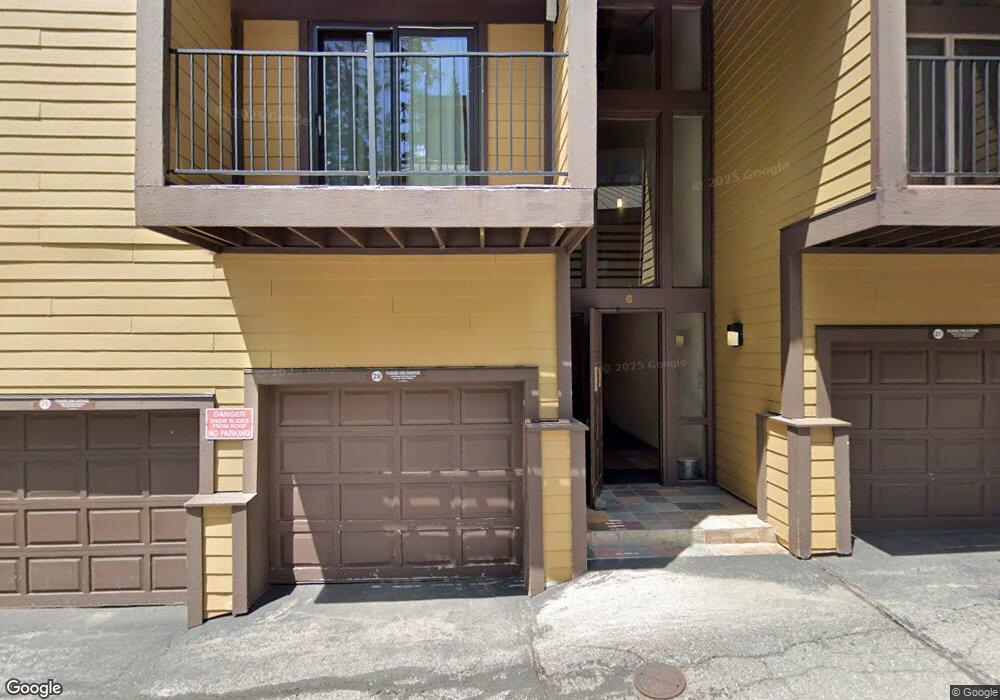
2201 Scott Peak Place Unit 36 Alpine Meadows, CA 96146
Alpine Meadows NeighborhoodEstimated Value: $736,000 - $916,000
4
Beds
3
Baths
1,459
Sq Ft
$561/Sq Ft
Est. Value
About This Home
This home is located at 2201 Scott Peak Place Unit 36, Alpine Meadows, CA 96146 and is currently estimated at $818,886, approximately $561 per square foot. 2201 Scott Peak Place Unit 36 is a home located in Placer County with nearby schools including Tahoe Lake Elementary School, North Tahoe School, and North Tahoe High School.
Ownership History
Date
Name
Owned For
Owner Type
Purchase Details
Closed on
Nov 25, 2008
Sold by
Schaadt Russell N
Bought by
Schaadt Russell Neil and Schaadt Mary Elizabeth
Current Estimated Value
Purchase Details
Closed on
Jun 10, 2003
Sold by
Schaadt Mary Honien
Bought by
Schaadt Russell Neil
Purchase Details
Closed on
May 26, 2001
Sold by
Olson James F and Olson Pamella
Bought by
Olson James F and Olson Pamella
Purchase Details
Closed on
May 30, 2000
Sold by
Boeye J John & Marjorie Trs
Bought by
Olson James F and Olson Pam
Home Financials for this Owner
Home Financials are based on the most recent Mortgage that was taken out on this home.
Original Mortgage
$130,000
Interest Rate
8.15%
Create a Home Valuation Report for This Property
The Home Valuation Report is an in-depth analysis detailing your home's value as well as a comparison with similar homes in the area
Home Values in the Area
Average Home Value in this Area
Purchase History
| Date | Buyer | Sale Price | Title Company |
|---|---|---|---|
| Schaadt Russell Neil | -- | None Available | |
| Schaadt Russell Neil | -- | Fidelity Title | |
| Schaadt Russell N | $285,000 | Fidelity Title | |
| Olson James F | -- | -- | |
| Olson James F | $185,000 | Placer Title Company |
Source: Public Records
Mortgage History
| Date | Status | Borrower | Loan Amount |
|---|---|---|---|
| Previous Owner | Olson James F | $130,000 |
Source: Public Records
Tax History
| Year | Tax Paid | Tax Assessment Tax Assessment Total Assessment is a certain percentage of the fair market value that is determined by local assessors to be the total taxable value of land and additions on the property. | Land | Improvement |
|---|---|---|---|---|
| 2025 | $4,911 | $412,750 | $144,820 | $267,930 |
| 2023 | $4,911 | $396,725 | $139,198 | $257,527 |
| 2022 | $4,680 | $388,947 | $136,469 | $252,478 |
| 2021 | $4,514 | $381,322 | $133,794 | $247,528 |
| 2020 | $4,522 | $377,413 | $132,423 | $244,990 |
| 2019 | $4,567 | $370,014 | $129,827 | $240,187 |
| 2018 | $4,142 | $362,760 | $127,282 | $235,478 |
| 2017 | $4,067 | $355,648 | $124,787 | $230,861 |
| 2016 | $4,027 | $348,676 | $122,341 | $226,335 |
| 2015 | $3,949 | $343,440 | $120,504 | $222,936 |
| 2014 | $3,435 | $300,000 | $100,000 | $200,000 |
Source: Public Records
Map
Nearby Homes
- 2201 Scott Peak Place
- 2201 Scott Peak Place Unit 49
- 2090 Chalet Rd Unit 2
- 2090 Chalet Rd Unit 16
- 2090 Chalet Rd Unit 4
- 1557 Alpine Meadows Rd
- 1456 Mineral Springs Trail
- 1416 Mineral Springs Trail
- xxxxx Alpine Meadows Rd
- 1037 Snow Crest Rd
- 1018 Snow Crest Rd
- 201 Shirley Canyon Rd Unit 233
- 201 Shirley Canyon Rd Unit 302
- 201 Shirley Canyon Rd Unit 309
- 201 Shirley Canyon Rd Unit 812
- 201 Shirley Canyon Rd Unit 714
- 1750 Village East Rd Unit 409 (5-409)
- 1985 Olympic Valley Rd Unit 2-312
- 1985 Olympic Valley Rd Unit 418
- 1985 Olympic Valley Rd Unit 2-419
- 2201 Scott Peak Place Unit 38
- 2201 Scott Peak Place Unit 35
- 2201 Scott Peak Place Unit 34
- 2201 Scott Peak Place Unit 37
- 2201 Scott Peak Place Unit 33
- 2201 Scott Peak Place Unit 32
- 2201 Scott Peak Place Unit 29
- 2201 Scott Peak Place Unit 28
- 2201 Scott Peak Place Unit 31
- 2201 Scott Peak Place Unit 30
- 2201 Scott Peak Place Unit 48
- 2201 Scott Peak Place Unit 47
- 2201 Scott Peak Place Unit 46
- 2201 Scott Peak Place Unit 45
- 2201 Scott Peak Place Unit 44
- 2201 Scott Peak Place Unit 43
- 2201 Scott Peak Place Unit 42
- 2201 Scott Peak Place Unit 41
- 2201 Scott Peak Place Unit 40
- 2201 Scott Peak Place Unit 39
Your Personal Tour Guide
Ask me questions while you tour the home.