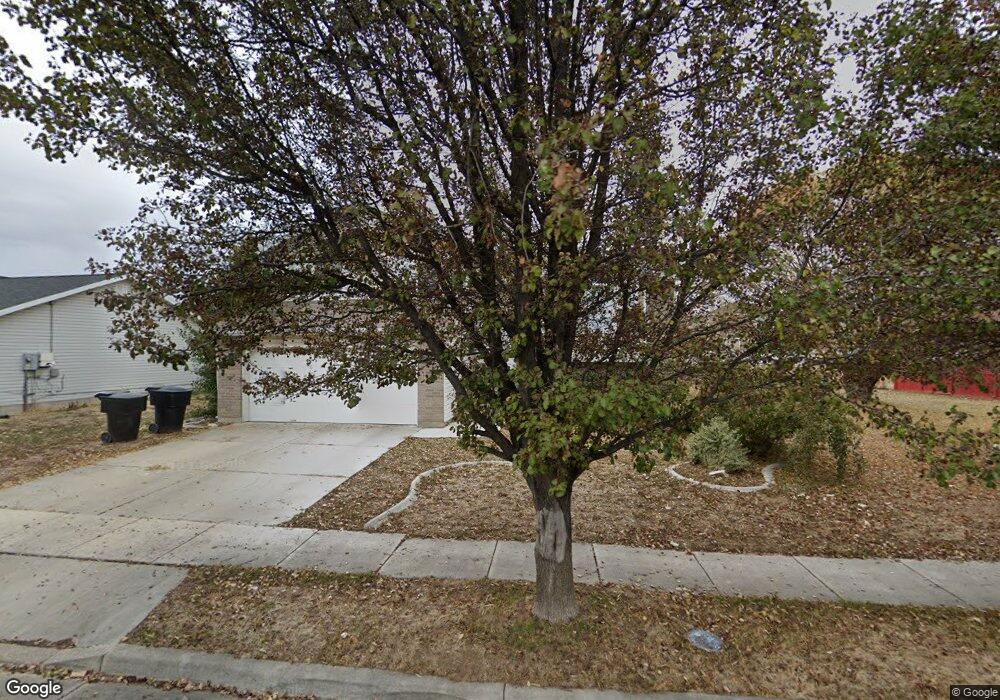
2201 W 2075 N Unit 28 Clearfield, UT 84015
Estimated Value: $449,000 - $504,000
4
Beds
3
Baths
1,535
Sq Ft
$311/Sq Ft
Est. Value
About This Home
This home is located at 2201 W 2075 N Unit 28, Clearfield, UT 84015 and is currently estimated at $477,031, approximately $310 per square foot. 2201 W 2075 N Unit 28 is a home located in Davis County with nearby schools including Parkside Elementary School, West Point Junior High School, and Clearfield High School.
Ownership History
Date
Name
Owned For
Owner Type
Purchase Details
Closed on
Jan 29, 2013
Sold by
Langford Terry N and Langford Jean
Bought by
American Homes 4 Rent Properties Three L
Current Estimated Value
Purchase Details
Closed on
Mar 19, 2007
Sold by
Pehrson James E and Pehrson Brenda L
Bought by
Langford Terry N and Langford Jean
Home Financials for this Owner
Home Financials are based on the most recent Mortgage that was taken out on this home.
Original Mortgage
$176,800
Interest Rate
6.31%
Mortgage Type
Purchase Money Mortgage
Purchase Details
Closed on
Nov 9, 2001
Sold by
Dennis Higley Inc
Bought by
Pehrson James E and Pehrson Brenda L
Home Financials for this Owner
Home Financials are based on the most recent Mortgage that was taken out on this home.
Original Mortgage
$83,800
Interest Rate
6.73%
Create a Home Valuation Report for This Property
The Home Valuation Report is an in-depth analysis detailing your home's value as well as a comparison with similar homes in the area
Home Values in the Area
Average Home Value in this Area
Purchase History
| Date | Buyer | Sale Price | Title Company |
|---|---|---|---|
| American Homes 4 Rent Properties Three L | -- | Inwest Title Services | |
| Langford Terry N | -- | First American Title | |
| Pehrson James E | -- | Equity Title Agency |
Source: Public Records
Mortgage History
| Date | Status | Borrower | Loan Amount |
|---|---|---|---|
| Previous Owner | Langford Terry N | $176,800 | |
| Previous Owner | Pehrson James E | $83,800 |
Source: Public Records
Tax History Compared to Growth
Tax History
| Year | Tax Paid | Tax Assessment Tax Assessment Total Assessment is a certain percentage of the fair market value that is determined by local assessors to be the total taxable value of land and additions on the property. | Land | Improvement |
|---|---|---|---|---|
| 2025 | $2,517 | $242,000 | $93,812 | $148,188 |
| 2024 | $2,544 | $245,849 | $102,757 | $143,092 |
| 2023 | $2,326 | $228,800 | $64,650 | $164,149 |
| 2022 | $2,518 | $453,000 | $129,328 | $323,672 |
| 2021 | $2,282 | $335,000 | $90,356 | $244,644 |
| 2020 | $1,983 | $288,000 | $77,478 | $210,522 |
| 2019 | $1,959 | $278,000 | $89,243 | $188,757 |
| 2018 | $1,772 | $247,000 | $75,210 | $171,790 |
| 2016 | $1,527 | $109,945 | $27,768 | $82,177 |
| 2015 | $1,513 | $103,565 | $27,768 | $75,797 |
| 2014 | $1,469 | $102,171 | $27,768 | $74,403 |
| 2013 | -- | $96,264 | $27,143 | $69,121 |
Source: Public Records
Map
Nearby Homes
- 2616 N 2125 W Unit 147
- 2034 N 2095 W
- 2184 N 2000 W
- 2318 N 2100 W
- 2434 W 2250 N
- Harvard Plan at Summerfield - Enclave
- 2208 W 2615 N
- Linden Plan at Summerfield - Vista
- Yale Plan at Summerfield - Enclave
- Gambel Oak Plan at Summerfield - Vista
- Cedar Plan at Summerfield - Vista
- Elm Plan at Summerfield - Vista
- Princeton Plan at Summerfield - Enclave
- Cambridge Plan at Summerfield - Enclave
- Cornell Plan at Summerfield - Enclave
- Sycamore Plan at Summerfield - Vista
- Berkeley Plan at Summerfield - Enclave
- Birch Plan at Summerfield - Vista
- Stanford Plan at Summerfield - Enclave
- 2219 N 2475 W
- 2201 W 2075 N
- 2179 W 2075 N
- 2179 W 2075 N Unit 27
- 2219 W 2075 N Unit 29
- 2034 N 2195 W
- 2037 N 2195 W
- 2194 W 2075 N
- 2216 W 2075 N
- 2216 W 2075 N Unit 18
- 2037 N 2165 W
- 2178 W 2075 N
- 2036 N 2225 W
- 2018 N 2195 W
- 2019 N 2195 W
- 2159 W 2075 N
- 2159 W 2075 N Unit 26
- 2239 W 2075 N
- 2019 N 2165 W
- 2022 N 2225 W
- 2012 N 2195 W