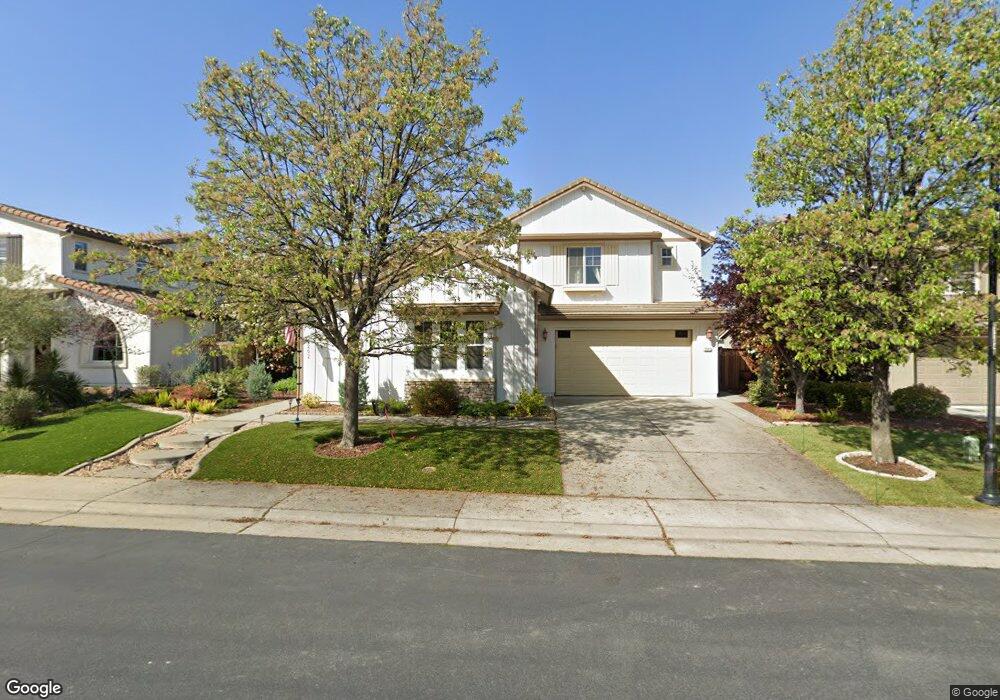
2202 Boarding House Ln Unit Lot2 Rocklin, CA 95765
Whitney Ranch NeighborhoodEstimated Value: $945,000 - $1,028,000
5
Beds
5
Baths
3,720
Sq Ft
$261/Sq Ft
Est. Value
About This Home
This home is located at 2202 Boarding House Ln Unit Lot2, Rocklin, CA 95765 and is currently estimated at $970,100, approximately $260 per square foot. 2202 Boarding House Ln Unit Lot2 is a home located in Placer County with nearby schools including Sunset Ranch Elementary, Granite Oaks Middle, and Whitney High.
Ownership History
Date
Name
Owned For
Owner Type
Purchase Details
Closed on
Apr 11, 2014
Sold by
Coate Rachelle S and Coate Jack R
Bought by
Gillrath Elmar and Stove Kerstin R
Current Estimated Value
Home Financials for this Owner
Home Financials are based on the most recent Mortgage that was taken out on this home.
Original Mortgage
$395,000
Outstanding Balance
$279,297
Interest Rate
2.59%
Mortgage Type
Adjustable Rate Mortgage/ARM
Estimated Equity
$690,803
Purchase Details
Closed on
Nov 10, 2008
Sold by
William Lyon Homes Inc
Bought by
Coate Rachelle S and Coate Jack R
Home Financials for this Owner
Home Financials are based on the most recent Mortgage that was taken out on this home.
Original Mortgage
$467,829
Interest Rate
6.07%
Mortgage Type
VA
Create a Home Valuation Report for This Property
The Home Valuation Report is an in-depth analysis detailing your home's value as well as a comparison with similar homes in the area
Home Values in the Area
Average Home Value in this Area
Purchase History
| Date | Buyer | Sale Price | Title Company |
|---|---|---|---|
| Gillrath Elmar | $561,500 | Old Republic Title Company | |
| Coate Rachelle S | $485,000 | Fidelity National Title Co |
Source: Public Records
Mortgage History
| Date | Status | Borrower | Loan Amount |
|---|---|---|---|
| Open | Gillrath Elmar | $395,000 | |
| Previous Owner | Coate Rachelle S | $467,829 |
Source: Public Records
Tax History Compared to Growth
Tax History
| Year | Tax Paid | Tax Assessment Tax Assessment Total Assessment is a certain percentage of the fair market value that is determined by local assessors to be the total taxable value of land and additions on the property. | Land | Improvement |
|---|---|---|---|---|
| 2025 | $11,353 | $723,311 | $104,194 | $619,117 |
| 2023 | $11,353 | $695,226 | $100,149 | $595,077 |
| 2022 | $10,896 | $675,095 | $98,186 | $576,909 |
| 2021 | $10,350 | $635,878 | $96,261 | $539,617 |
| 2020 | $10,282 | $629,358 | $95,274 | $534,084 |
| 2019 | $10,125 | $617,018 | $93,406 | $523,612 |
| 2018 | $9,854 | $604,921 | $91,575 | $513,346 |
| 2017 | $9,783 | $593,061 | $89,780 | $503,281 |
| 2016 | $9,932 | $581,433 | $88,020 | $493,413 |
| 2015 | $9,798 | $572,700 | $86,698 | $486,002 |
| 2014 | $9,141 | $513,533 | $84,037 | $429,496 |
Source: Public Records
Map
Nearby Homes
- 965 Browning Ln
- 925 Farm House Ct
- 902 Anvil Cir
- 903 Jack Rabbit Ct
- 1617 Arroyo Sierra Way
- 1468 Westwind Way
- 1692 Plan at Westwind at Whitney Ranch
- 2054 Plan at Westwind at Whitney Ranch
- 1343 Plan at Westwind at Whitney Ranch
- 1472 Westwind Way
- 5317 Clipper Ct
- 946 Campfire Cir
- 809 Big Range Way
- 947 Campfire Cir
- 813 Big Range Way
- 961 Campfire Cir
- 2408 Galloping Trail Ct
- 807 Calico Dr
- 1250 Whitney Ranch Pkwy Unit 213
- 1240 Whitney Ranch Pkwy Unit 333
- 2202 Boarding House Ln
- 2204 Boarding House Ln
- 2200 Boarding House Ln
- 913 Flatiron Ln
- 915 Flatiron Ln
- 2206 Boarding House Ln
- 911 Flatiron Ln
- 917 Flatiron Ln
- 901 Farm House Ln
- 819 Spotted Pony Ln
- 822 Spotted Pony Ln
- 824 Spotted Pony Ln
- 2208 Boarding House Ct
- 903 Farm House Ln
- 817 Spotted Pony Ln
- 919 Flatiron Ln
- 900 Flatiron Ct
- 921 Flatiron Ln
- 820 Spotted Pony Ln
- 818 Spotted Pony Ln