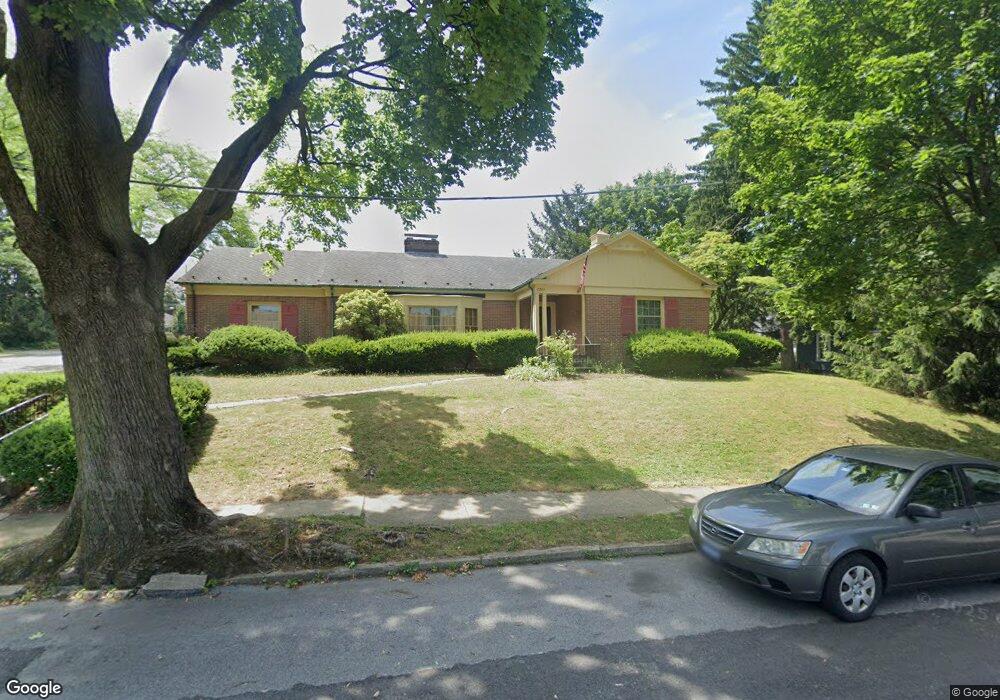
2202 W Walnut St Unit 2212 Allentown, PA 18104
West End Allentown NeighborhoodEstimated Value: $365,000 - $430,000
3
Beds
2
Baths
1,945
Sq Ft
$210/Sq Ft
Est. Value
About This Home
This home is located at 2202 W Walnut St Unit 2212, Allentown, PA 18104 and is currently estimated at $409,278, approximately $210 per square foot. 2202 W Walnut St Unit 2212 is a home located in Lehigh County with nearby schools including Huntington Elementary School, Cleveland School, and Union Terrace Elementary School.
Ownership History
Date
Name
Owned For
Owner Type
Purchase Details
Closed on
Sep 18, 2023
Sold by
Machose Adam W
Bought by
Nagy Sean
Current Estimated Value
Home Financials for this Owner
Home Financials are based on the most recent Mortgage that was taken out on this home.
Original Mortgage
$450,000
Outstanding Balance
$440,686
Interest Rate
7.09%
Mortgage Type
New Conventional
Estimated Equity
-$31,408
Purchase Details
Closed on
Apr 26, 2004
Sold by
Machose William R and Machose Merrie B
Bought by
Machose Merrie B
Home Financials for this Owner
Home Financials are based on the most recent Mortgage that was taken out on this home.
Original Mortgage
$136,000
Interest Rate
5.36%
Mortgage Type
Stand Alone Refi Refinance Of Original Loan
Purchase Details
Closed on
Jun 2, 1986
Sold by
Rabenold Anson E and Rabenold Barbara D
Bought by
Machose William R and Machose Merrie B
Purchase Details
Closed on
Aug 30, 1976
Bought by
Rabenold Anson E and Rabenold Barbara D
Create a Home Valuation Report for This Property
The Home Valuation Report is an in-depth analysis detailing your home's value as well as a comparison with similar homes in the area
Home Values in the Area
Average Home Value in this Area
Purchase History
| Date | Buyer | Sale Price | Title Company |
|---|---|---|---|
| Nagy Sean | $360,000 | None Listed On Document | |
| Machose Merrie B | -- | -- | |
| Machose William R | $115,000 | -- | |
| Rabenold Anson E | $70,000 | -- |
Source: Public Records
Mortgage History
| Date | Status | Borrower | Loan Amount |
|---|---|---|---|
| Open | Nagy Sean | $450,000 | |
| Previous Owner | Machose Merrie B | $136,000 | |
| Closed | Machose Merrie B | $17,000 |
Source: Public Records
Tax History Compared to Growth
Tax History
| Year | Tax Paid | Tax Assessment Tax Assessment Total Assessment is a certain percentage of the fair market value that is determined by local assessors to be the total taxable value of land and additions on the property. | Land | Improvement |
|---|---|---|---|---|
| 2025 | $7,293 | $211,300 | $40,300 | $171,000 |
| 2024 | $7,293 | $211,300 | $40,300 | $171,000 |
| 2023 | $7,293 | $211,300 | $40,300 | $171,000 |
| 2022 | $7,052 | $211,300 | $171,000 | $40,300 |
| 2021 | $6,920 | $211,300 | $40,300 | $171,000 |
| 2020 | $6,750 | $211,300 | $40,300 | $171,000 |
| 2019 | $6,648 | $211,300 | $40,300 | $171,000 |
| 2018 | $6,145 | $211,300 | $40,300 | $171,000 |
| 2017 | $5,998 | $211,300 | $40,300 | $171,000 |
| 2016 | -- | $211,300 | $40,300 | $171,000 |
| 2015 | -- | $211,300 | $40,300 | $171,000 |
| 2014 | -- | $211,300 | $40,300 | $171,000 |
Source: Public Records
Map
Nearby Homes
- 320 S 22nd St
- 215 S 23rd St
- 2411 Union St
- 2317-2319 Elm St
- 403 S 24th St
- 1840 W Turner St
- 2140 W Gordon St
- 215 N 19th St
- 2133 W Gordon St Unit 2135
- 1852 W Chew St
- 129 S Saint Cloud St
- 419 S Ott St
- 39 S 17th St
- 128 S West St
- 406 S 17th St
- 1742 W Chew St
- 525 N Leh St
- 2270 Bishop Rd
- 871 Robin Hood Dr
- 2823 Hamilton Blvd
- 2214 W Walnut St Unit 2216
- 114 S 22nd St Unit 116
- 2218 W Walnut St Unit 2220
- 122 S 22nd St
- 120 S 22nd St Unit 122
- 107 S Leh St
- 2207 W Walnut St
- 2209 W Walnut St
- 2205 W Walnut St
- 117 S Leh St
- 2213 W Walnut St Unit 2217
- 2211 W Walnut St
- 2203 W Walnut St
- 113 S Leh St Unit 121
- 2201 W Walnut St
- 2151 W Walnut St
- 2128 W Walnut St Unit 2152
- 2147 W Walnut St
- 2140 Walnut St
- 2201 W Union St Unit 2209