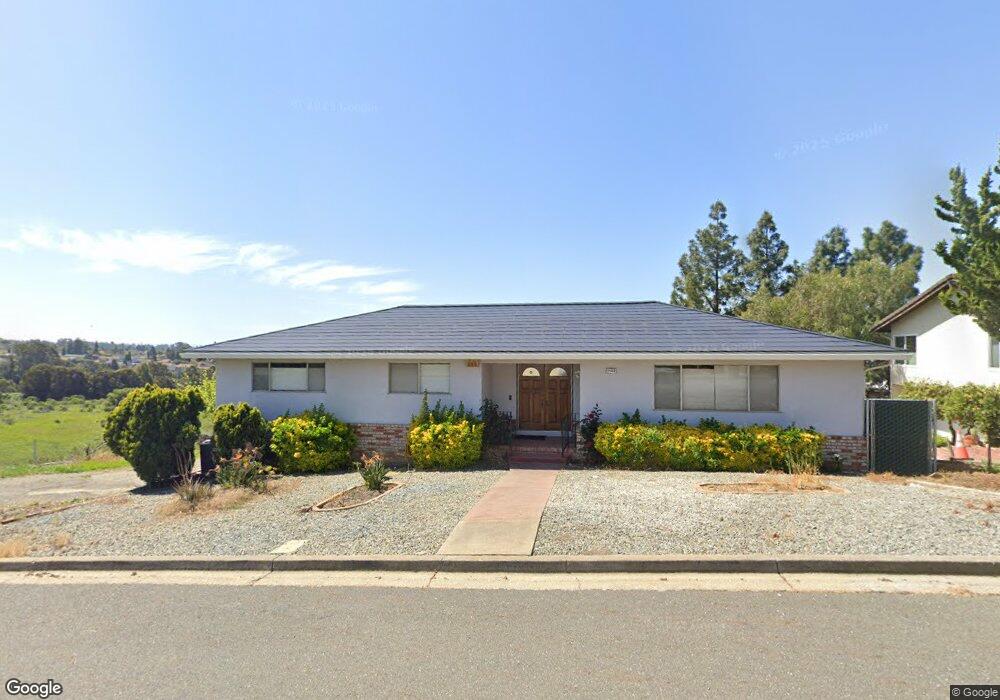
22023 Chaparral Ln Castro Valley, CA 94552
Castro Valley East NeighborhoodEstimated Value: $1,260,000 - $1,389,000
3
Beds
2
Baths
1,955
Sq Ft
$673/Sq Ft
Est. Value
About This Home
This home is located at 22023 Chaparral Ln, Castro Valley, CA 94552 and is currently estimated at $1,316,521, approximately $673 per square foot. 22023 Chaparral Ln is a home located in Alameda County with nearby schools including Independent Elementary School, Creekside Middle School, and Canyon Middle School.
Ownership History
Date
Name
Owned For
Owner Type
Purchase Details
Closed on
Nov 14, 2023
Sold by
Siu Jose Samuel and Siu Angie
Bought by
Siu Family Trust and Siu
Current Estimated Value
Purchase Details
Closed on
May 24, 2007
Sold by
Siu Jose S and Siu Angie Lou
Bought by
Siu Jose S and Siu Angie Lou
Home Financials for this Owner
Home Financials are based on the most recent Mortgage that was taken out on this home.
Original Mortgage
$490,000
Interest Rate
6.12%
Mortgage Type
New Conventional
Purchase Details
Closed on
Aug 22, 2000
Sold by
Morgan Charles B
Bought by
Chin Siu Jose S and Chin Lou Yin
Home Financials for this Owner
Home Financials are based on the most recent Mortgage that was taken out on this home.
Original Mortgage
$364,000
Interest Rate
7.87%
Purchase Details
Closed on
Jan 19, 1999
Sold by
Morgan Charles B
Bought by
Morgan Charles M and Charles B Morgan Jr 1999 Trust
Create a Home Valuation Report for This Property
The Home Valuation Report is an in-depth analysis detailing your home's value as well as a comparison with similar homes in the area
Home Values in the Area
Average Home Value in this Area
Purchase History
| Date | Buyer | Sale Price | Title Company |
|---|---|---|---|
| Siu Family Trust | -- | None Listed On Document | |
| Siu Jose S | -- | Commonwealth Land Title Co | |
| Chin Siu Jose S | $455,000 | North American Title Co | |
| Morgan Charles M | -- | -- | |
| Morgan Charles B | -- | -- |
Source: Public Records
Mortgage History
| Date | Status | Borrower | Loan Amount |
|---|---|---|---|
| Previous Owner | Siu Jose S | $490,000 | |
| Previous Owner | Chin Siu Jose S | $364,000 |
Source: Public Records
Tax History Compared to Growth
Tax History
| Year | Tax Paid | Tax Assessment Tax Assessment Total Assessment is a certain percentage of the fair market value that is determined by local assessors to be the total taxable value of land and additions on the property. | Land | Improvement |
|---|---|---|---|---|
| 2025 | $8,677 | $678,561 | $205,668 | $479,893 |
| 2024 | $8,677 | $665,121 | $201,636 | $470,485 |
| 2023 | $8,535 | $658,944 | $197,683 | $461,261 |
| 2022 | $8,368 | $639,027 | $193,808 | $452,219 |
| 2021 | $8,153 | $626,360 | $190,008 | $443,352 |
| 2020 | $7,966 | $626,867 | $188,060 | $438,807 |
| 2019 | $8,111 | $614,577 | $184,373 | $430,204 |
| 2018 | $7,881 | $602,528 | $180,758 | $421,770 |
| 2017 | $7,673 | $590,717 | $177,215 | $413,502 |
| 2016 | $7,301 | $579,137 | $173,741 | $405,396 |
| 2015 | $6,823 | $570,441 | $171,132 | $399,309 |
| 2014 | $6,742 | $559,271 | $167,781 | $391,490 |
Source: Public Records
Map
Nearby Homes
- 21798 Independent School Rd
- 0 Jensen Rd Unit 41089385
- 3594 Cama Ln
- 22679 Valley View Dr
- 3285 Monika Ln
- 3264 Monika Ln
- 3238 Monika Ln
- 5389 San Simeon Place
- 3241 Monika Ln
- 4937 Crow Canyon Rd
- 22561 Mossy Rock Dr
- 4597 Edwards Ln
- 22633 Mossy Rock Dr
- 3287 Kelly St
- 5288 Crown Ct
- 4525 Edwards Ln
- 23049 Lakeridge Ave
- 19430 Center St
- 22490 Bayview Ave
- 3998 Castro Valley Blvd Unit 34
- 22019 Chaparral Ln
- 4161 High Ridge Place
- 22020 Chaparral Ln
- 22015 Chaparral Ln
- 4165 High Ridge Place
- 4160 High Ridge Place
- 22011 Chaparral Ln
- 4164 High Ridge Place
- 4169 High Ridge Place
- 4001 E Castro Valley Blvd
- 4163 Chaparral Place
- 22007 Chaparral Ln
- 4168 High Ridge Place
- 4167 Chaparral Place
- 4301 Old Dublin Rd
- 4171 Chaparral Place
- 22003 Chaparral Ln
- 4162 Chaparral Place
- 4166 Chaparral Place
- 4311 Old Dublin Rd