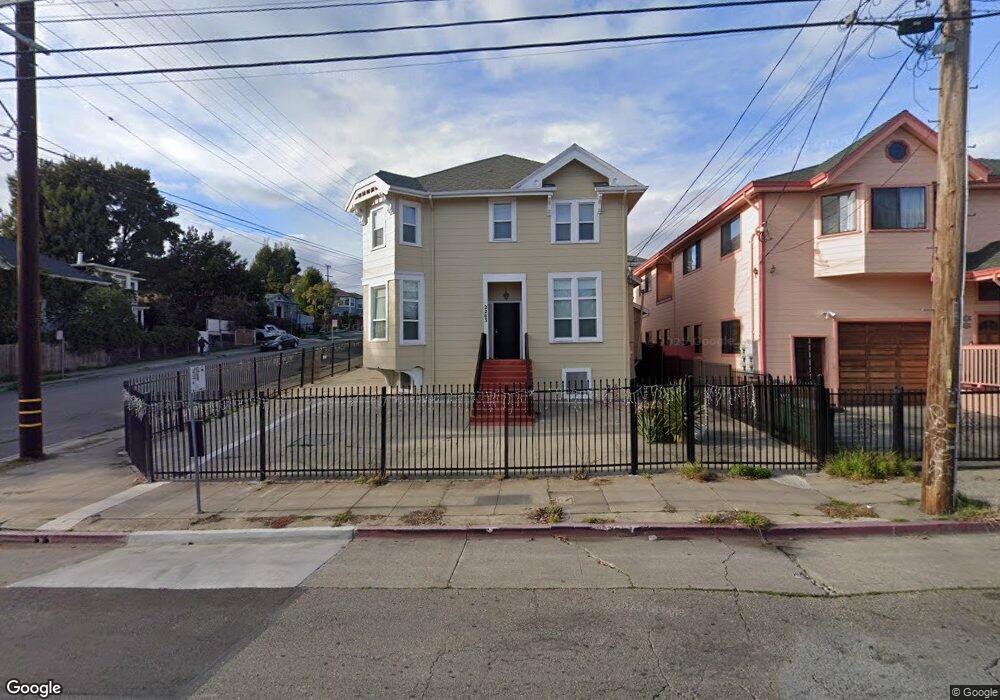
2203 8th Ave Oakland, CA 94606
Ivy Hill NeighborhoodEstimated Value: $741,000 - $1,057,848
5
Beds
2
Baths
2,431
Sq Ft
$372/Sq Ft
Est. Value
About This Home
This home is located at 2203 8th Ave, Oakland, CA 94606 and is currently estimated at $903,712, approximately $371 per square foot. 2203 8th Ave is a home located in Alameda County with nearby schools including Bella Vista Elementary School, Edna Brewer Middle School, and Oakland High School.
Ownership History
Date
Name
Owned For
Owner Type
Purchase Details
Closed on
Sep 10, 2019
Sold by
Thach Danny Duong and He Wang Juan
Bought by
Duong Thach Danny and He Wang Juan
Current Estimated Value
Home Financials for this Owner
Home Financials are based on the most recent Mortgage that was taken out on this home.
Original Mortgage
$501,000
Interest Rate
3.5%
Mortgage Type
New Conventional
Purchase Details
Closed on
Jan 11, 2018
Sold by
Thach Duong A and He Wang Juan
Bought by
Thach Duong A and He Wang Juan
Home Financials for this Owner
Home Financials are based on the most recent Mortgage that was taken out on this home.
Original Mortgage
$510,000
Interest Rate
4.87%
Mortgage Type
Adjustable Rate Mortgage/ARM
Purchase Details
Closed on
May 23, 2002
Sold by
Thach Duong A
Bought by
Wang Thach Duong A and Wang He Juan
Home Financials for this Owner
Home Financials are based on the most recent Mortgage that was taken out on this home.
Original Mortgage
$300,000
Interest Rate
6.89%
Create a Home Valuation Report for This Property
The Home Valuation Report is an in-depth analysis detailing your home's value as well as a comparison with similar homes in the area
Home Values in the Area
Average Home Value in this Area
Purchase History
We collect this data history from publicly available records. To have your information removed, we recommend requesting removal directly through your county’s website.
| Date | Buyer | Sale Price | Title Company |
|---|---|---|---|
| Duong Thach Danny | -- | Old Republic Title Company | |
| Thach Duong A | -- | Old Republic Title Company | |
| Wang Thach Duong A | -- | First American Title Guarant |
Source: Public Records
Mortgage History
We collect this data history from publicly available records. To have your information removed, we recommend requesting removal directly through your county’s website.
| Date | Status | Borrower | Loan Amount |
|---|---|---|---|
| Closed | Duong Thach Danny | $501,000 | |
| Closed | Thach Duong A | $510,000 | |
| Closed | Wang Thach Duong A | $300,000 |
Source: Public Records
Tax History
| Year | Tax Paid | Tax Assessment Tax Assessment Total Assessment is a certain percentage of the fair market value that is determined by local assessors to be the total taxable value of land and additions on the property. | Land | Improvement |
|---|---|---|---|---|
| 2025 | $6,109 | $304,575 | $159,145 | $145,430 |
| 2024 | $6,109 | $298,603 | $156,024 | $142,579 |
| 2023 | $6,293 | $292,748 | $152,965 | $139,783 |
| 2022 | $6,009 | $287,010 | $149,967 | $137,043 |
| 2021 | $5,580 | $281,382 | $147,026 | $134,356 |
| 2020 | $5,516 | $278,497 | $145,519 | $132,978 |
| 2019 | $5,203 | $273,037 | $142,666 | $130,371 |
| 2018 | $5,097 | $267,684 | $139,869 | $127,815 |
| 2017 | $4,860 | $262,435 | $137,126 | $125,309 |
| 2016 | $4,648 | $257,290 | $134,438 | $122,852 |
| 2015 | $4,620 | $253,427 | $132,419 | $121,008 |
| 2014 | $4,694 | $248,462 | $129,825 | $118,637 |
Source: Public Records
Map
Nearby Homes
- 2217 8th Ave
- 726 E 22nd St
- 2141 8th Ave
- 720 E 22nd St Unit 306
- 2225 8th Ave
- 716 E 22nd St
- 2135 8th Ave
- 2233 8th Ave
- 2200 8th Ave
- 2208 8th Ave
- 2129 8th Ave
- 2212 8th Ave
- 725 E 22nd St
- 2218 8th Ave
- 715 E 22nd St
- 2241 8th Ave
- 721 E 22nd St
- 710 E 22nd St Unit 308
- 710 E 22nd St Unit 101
- 710 E 22nd St Unit 307
Your Personal Tour Guide
Ask me questions while you tour the home.