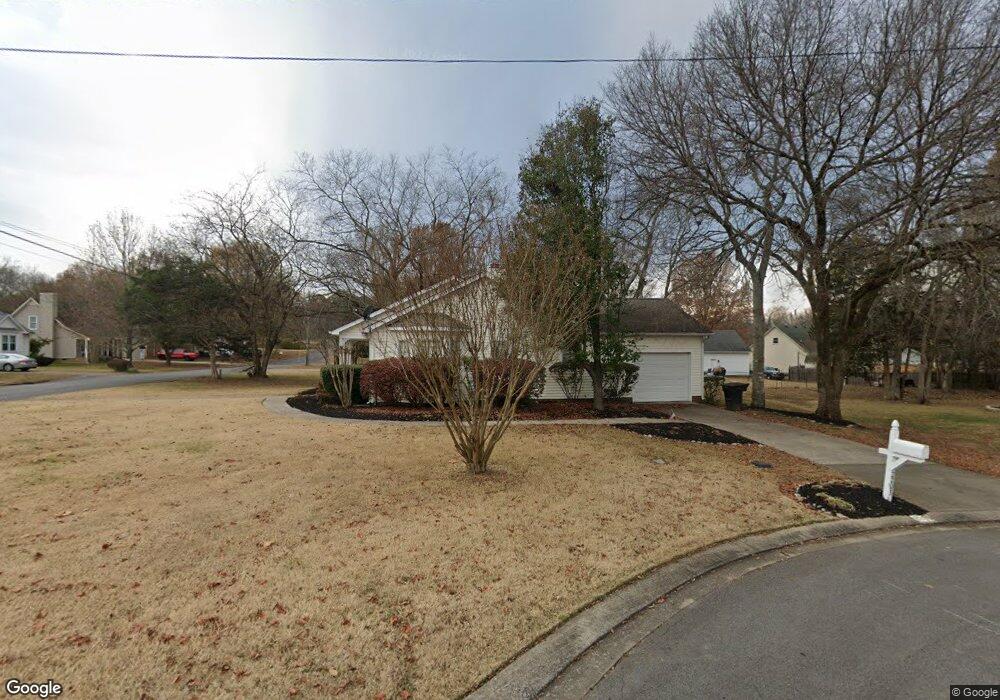
2203 Caleb Ct Murfreesboro, TN 37129
Estimated Value: $280,000 - $348,000
--
Bed
2
Baths
1,348
Sq Ft
$239/Sq Ft
Est. Value
About This Home
This home is located at 2203 Caleb Ct, Murfreesboro, TN 37129 and is currently estimated at $322,797, approximately $239 per square foot. 2203 Caleb Ct is a home located in Rutherford County with nearby schools including Northfield Elementary School, Siegel Middle School, and Siegel High School.
Ownership History
Date
Name
Owned For
Owner Type
Purchase Details
Closed on
Jul 30, 2007
Sold by
Moore Kevin C
Bought by
Kristen Wolohon
Current Estimated Value
Home Financials for this Owner
Home Financials are based on the most recent Mortgage that was taken out on this home.
Original Mortgage
$125,302
Outstanding Balance
$78,848
Interest Rate
6.63%
Mortgage Type
Purchase Money Mortgage
Estimated Equity
$243,949
Purchase Details
Closed on
Jul 15, 2005
Sold by
Anthony Long
Bought by
Moore Kevin C and Moore Virginia J
Home Financials for this Owner
Home Financials are based on the most recent Mortgage that was taken out on this home.
Original Mortgage
$121,043
Interest Rate
5.59%
Mortgage Type
Purchase Money Mortgage
Create a Home Valuation Report for This Property
The Home Valuation Report is an in-depth analysis detailing your home's value as well as a comparison with similar homes in the area
Home Values in the Area
Average Home Value in this Area
Purchase History
| Date | Buyer | Sale Price | Title Company |
|---|---|---|---|
| Kristen Wolohon | $139,000 | -- | |
| Moore Kevin C | $37,129 | -- |
Source: Public Records
Mortgage History
| Date | Status | Borrower | Loan Amount |
|---|---|---|---|
| Open | Moore Kevin C | $125,302 | |
| Previous Owner | Moore Kevin C | $121,043 |
Source: Public Records
Tax History Compared to Growth
Tax History
| Year | Tax Paid | Tax Assessment Tax Assessment Total Assessment is a certain percentage of the fair market value that is determined by local assessors to be the total taxable value of land and additions on the property. | Land | Improvement |
|---|---|---|---|---|
| 2025 | $1,840 | $65,043 | $13,750 | $51,293 |
| 2024 | $1,840 | $65,043 | $13,750 | $51,293 |
| 2023 | $1,220 | $65,043 | $13,750 | $51,293 |
| 2022 | $1,051 | $65,043 | $13,750 | $51,293 |
| 2021 | $1,004 | $45,243 | $10,000 | $35,243 |
| 2020 | $1,004 | $45,243 | $10,000 | $35,243 |
| 2019 | $1,004 | $45,243 | $10,000 | $35,243 |
| 2018 | $1,380 | $45,243 | $0 | $0 |
| 2017 | $1,328 | $34,175 | $0 | $0 |
| 2016 | $1,328 | $34,175 | $0 | $0 |
| 2015 | $1,328 | $34,175 | $0 | $0 |
| 2014 | $850 | $34,175 | $0 | $0 |
| 2013 | -- | $34,875 | $0 | $0 |
Source: Public Records
Map
Nearby Homes
- 2207 Caleb Ct
- 1202 Marymont Dr
- 1206 Marymont Dr
- 2335 Bennington Dr
- 2206 Caleb Ct
- 2403 Bennington Dr
- 2330 Bennington Dr
- 2514 Jones Blvd
- 1210 Marymont Dr
- 2515 Jones Blvd
- 2407 Bennington Dr
- 2327 Bennington Dr
- 2406 Bennington Dr
- 2322 Bennington Dr
- 2510 Tinnell Ct
- 2411 Bennington Dr
- 2511 Jones Blvd
- 2510 Jones Blvd
- 2508 Tinnell Ct
- 1207 Marymont Dr