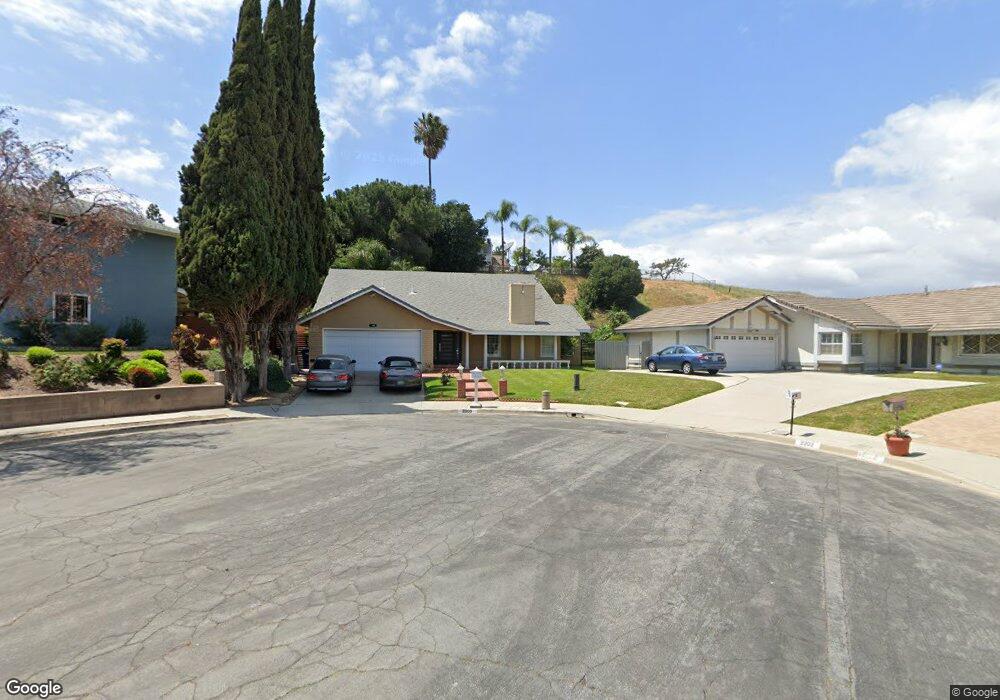
2203 Gnu Cir Rowland Heights, CA 91748
Estimated Value: $1,103,000 - $1,171,000
4
Beds
2
Baths
2,180
Sq Ft
$523/Sq Ft
Est. Value
About This Home
This home is located at 2203 Gnu Cir, Rowland Heights, CA 91748 and is currently estimated at $1,139,994, approximately $522 per square foot. 2203 Gnu Cir is a home located in Los Angeles County with nearby schools including Rowland Elementary School, Alvarado Intermediate School, and John A. Rowland High School.
Ownership History
Date
Name
Owned For
Owner Type
Purchase Details
Closed on
Nov 27, 2017
Sold by
Trujillo Jorge A and Flores Nohemi Y
Bought by
Trujillo Jorge A and Flores Nohemi Y
Current Estimated Value
Home Financials for this Owner
Home Financials are based on the most recent Mortgage that was taken out on this home.
Original Mortgage
$320,000
Outstanding Balance
$269,412
Interest Rate
3.94%
Mortgage Type
Purchase Money Mortgage
Estimated Equity
$870,582
Purchase Details
Closed on
May 24, 2001
Sold by
Lilly Everett A and Cummings Lilly Karen T
Bought by
Trujillo Jorge A and Flores Nohemi Y
Home Financials for this Owner
Home Financials are based on the most recent Mortgage that was taken out on this home.
Original Mortgage
$262,350
Interest Rate
7.14%
Purchase Details
Closed on
Aug 2, 1996
Sold by
Lilly Everett A and Cummings Lilly Karen T
Bought by
Lilly Everett A and Cummings Lilly Karen T
Create a Home Valuation Report for This Property
The Home Valuation Report is an in-depth analysis detailing your home's value as well as a comparison with similar homes in the area
Home Values in the Area
Average Home Value in this Area
Purchase History
| Date | Buyer | Sale Price | Title Company |
|---|---|---|---|
| Trujillo Jorge A | -- | Old Republic | |
| Trujillo Jorge A | $291,500 | Orange Coast Title | |
| Lilly Everett A | -- | -- |
Source: Public Records
Mortgage History
| Date | Status | Borrower | Loan Amount |
|---|---|---|---|
| Open | Trujillo Jorge A | $320,000 | |
| Closed | Trujillo Jorge A | $262,350 |
Source: Public Records
Tax History Compared to Growth
Tax History
| Year | Tax Paid | Tax Assessment Tax Assessment Total Assessment is a certain percentage of the fair market value that is determined by local assessors to be the total taxable value of land and additions on the property. | Land | Improvement |
|---|---|---|---|---|
| 2025 | $5,673 | $430,607 | $223,058 | $207,549 |
| 2024 | $5,673 | $422,165 | $218,685 | $203,480 |
| 2023 | $5,489 | $413,889 | $214,398 | $199,491 |
| 2022 | $5,368 | $405,775 | $210,195 | $195,580 |
| 2021 | $5,273 | $397,820 | $206,074 | $191,746 |
| 2019 | $5,117 | $386,021 | $199,962 | $186,059 |
| 2018 | $4,902 | $378,453 | $196,042 | $182,411 |
| 2017 | $4,803 | $371,034 | $192,199 | $178,835 |
| 2016 | $4,705 | $363,760 | $188,431 | $175,329 |
| 2015 | $4,630 | $358,297 | $185,601 | $172,696 |
| 2014 | $4,625 | $351,280 | $181,966 | $169,314 |
Source: Public Records
Map
Nearby Homes
- 2330 Donosa Dr
- 2503 Donosa Dr
- 18220 Gallineta St
- 2048 Calle Bogota
- 18239 Villa Clara St
- 17834 Calle Los Arboles
- 17712 Nearbank Dr
- 1948 Calle Bogota
- 18131 Camino Bello Unit 4
- 18138 Via Amorosa Unit 4
- 2426 Batson Ave
- 18225 Camino Bello Unit 4
- 2474 Patrician View Ave
- 18536 Mescal St
- 2010 La Cueva Dr
- 2306 Doubletree Ln
- 1902 Jellick Ave
- 2521 Doubletree Ln
- 18654 Del Bonita St
- 2634 Blandford Dr
- 2202 Gnu Cir
- 2202 Etongale Ave
- 18047 Galatina St
- 18043 Galatina St
- 2208 Etongale Ave
- 2203 Etongale Ave
- 2204 Gnu Cir
- 18037 Galatina St
- 2208 Gnu Cir
- 2216 Etongale Ave
- 2207 Etongale Ave
- 18033 Galatina St
- 18065 Galatina St
- 2211 Etongale Ave
- 2217 Etongale Ave
- 18064 Galatina St
- 18067 Galatina St
- 17959 Nearbank Dr
- 18021 Galatina St
- 17982 Nearbank Dr