
UNDER CONTRACT
$11K PRICE DROP
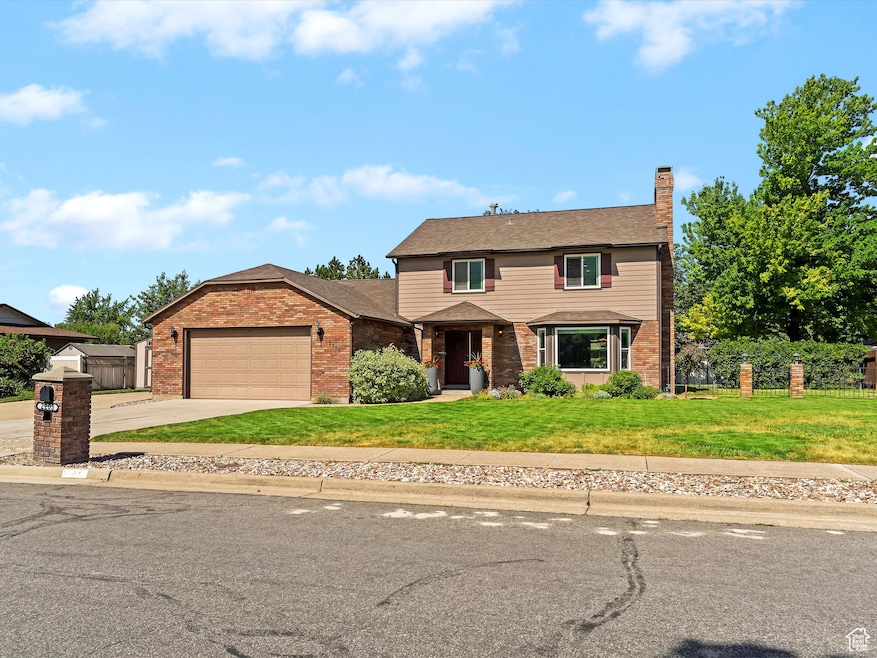
2203 Joni Dr Layton, UT 84040
Estimated payment $3,618/month
Total Views
7,440
5
Beds
3.5
Baths
3,542
Sq Ft
$175
Price per Sq Ft
Highlights
- Home Theater
- Mature Trees
- 4 Fireplaces
- RV or Boat Parking
- Mountain View
- No HOA
About This Home
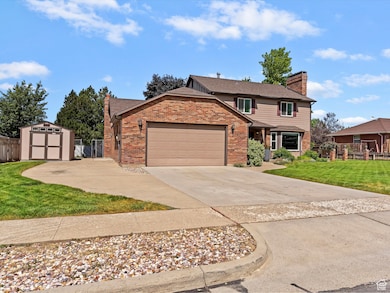
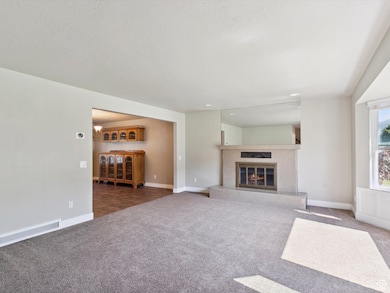
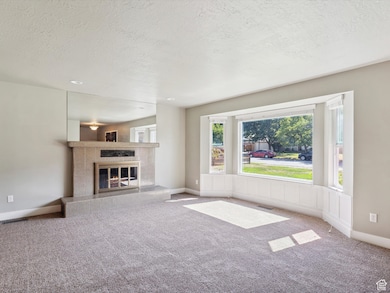
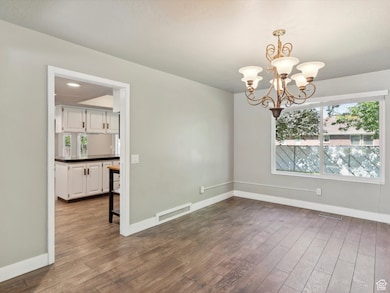
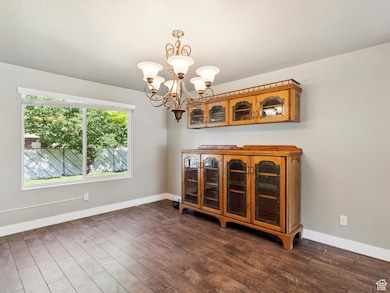
Set against the breathtaking Wasatch Mountains, this spacious Layton home offers classic curb appeal, a flexible floor plan, and unbeatable access to Northern Utah's best amenities. With east-facing mountain views and quick connectivity via HWY 89, you're minutes from Ogden, Salt Lake City, and world-class ski resorts. Inside, the home features multiple gathering spaces filled with natural light and timeless character. Brand new carpet has been installed on the main level and basement. A formal living room showcases a mirrored fireplace and large bay window, while the great room offers a cozy brick hearth and views of the private backyard. Downstairs, a dedicated theater room with surround sound sets the stage for unforgettable movie nights. Upstairs, the oversized primary suite is a standout-anchored by a striking rock fireplace and offering plenty of space to create your own retreat. Additional bedrooms and living areas provide flexibility for guests, work-from-home, or hobbies. The fully fenced backyard is shaded by mature trees and includes a covered patio perfect for summer evenings. A spacious garage with epoxy floors and a built-in vacuum system adds functionality and storage. With a versatile layout and views that never get old, this home is ready for its next chapter. Buyer to verify all.
Home Details
Home Type
- Single Family
Est. Annual Taxes
- $2,945
Year Built
- Built in 1979
Lot Details
- 0.28 Acre Lot
- Partially Fenced Property
- Landscaped
- Mature Trees
- Property is zoned Single-Family
Parking
- 2 Car Attached Garage
- 6 Open Parking Spaces
- RV or Boat Parking
Home Design
- Brick Exterior Construction
Interior Spaces
- 3,542 Sq Ft Home
- 3-Story Property
- Ceiling Fan
- 4 Fireplaces
- Self Contained Fireplace Unit Or Insert
- Gas Log Fireplace
- Double Pane Windows
- Blinds
- Sliding Doors
- Smart Doorbell
- Home Theater
- Mountain Views
- Smart Thermostat
- Gas Dryer Hookup
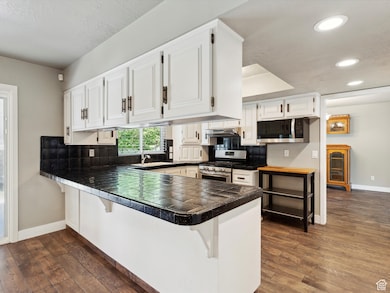
Kitchen
- Free-Standing Range
- Range Hood
- Microwave
- Disposal
Flooring
- Carpet
- Linoleum
- Laminate
- Tile
Bedrooms and Bathrooms
- 5 Bedrooms
Basement
- Walk-Out Basement
- Basement Fills Entire Space Under The House
- Exterior Basement Entry
Eco-Friendly Details
- Reclaimed Water Irrigation System
Outdoor Features
- Covered Patio or Porch
- Separate Outdoor Workshop
- Storage Shed
Schools
- Adams Elementary School
- North Layton Middle School
- Northridge High School
Utilities
- Forced Air Heating and Cooling System
- Natural Gas Connected
Community Details
- No Home Owners Association
- Oak Forest Subdivision
Listing and Financial Details
- Assessor Parcel Number 09-069-0157
Map
Create a Home Valuation Report for This Property
The Home Valuation Report is an in-depth analysis detailing your home's value as well as a comparison with similar homes in the area
Home Values in the Area
Average Home Value in this Area
Tax History
| Year | Tax Paid | Tax Assessment Tax Assessment Total Assessment is a certain percentage of the fair market value that is determined by local assessors to be the total taxable value of land and additions on the property. | Land | Improvement |
|---|---|---|---|---|
| 2024 | $2,946 | $289,849 | $158,463 | $131,386 |
| 2023 | $2,918 | $511,000 | $208,887 | $302,113 |
| 2022 | $3,072 | $294,250 | $112,462 | $181,788 |
| 2021 | $2,724 | $391,000 | $171,823 | $219,177 |
| 2020 | $2,044 | $275,000 | $141,804 | $133,196 |
| 2019 | $2,018 | $268,000 | $126,092 | $141,908 |
| 2018 | $1,859 | $248,000 | $100,265 | $147,735 |
| 2016 | $1,633 | $114,290 | $52,330 | $61,960 |
| 2015 | $1,582 | $105,820 | $52,330 | $53,490 |
| 2014 | $1,652 | $114,022 | $52,330 | $61,692 |
| 2013 | -- | $99,887 | $33,932 | $65,955 |
Source: Public Records
Property History
| Date | Event | Price | Change | Sq Ft Price |
|---|---|---|---|---|
| 07/16/2025 07/16/25 | Price Changed | $619,000 | -0.1% | $175 / Sq Ft |
| 07/16/2025 07/16/25 | Price Changed | $619,900 | -1.6% | $175 / Sq Ft |
| 06/19/2025 06/19/25 | For Sale | $629,900 | -- | $178 / Sq Ft |
Source: UtahRealEstate.com
Purchase History
| Date | Type | Sale Price | Title Company |
|---|---|---|---|
| Interfamily Deed Transfer | -- | First American Title Ins Co | |
| Interfamily Deed Transfer | -- | First American Title Ins Co | |
| Interfamily Deed Transfer | -- | None Available | |
| Warranty Deed | -- | First American Title Company | |
| Interfamily Deed Transfer | -- | -- |
Source: Public Records
Mortgage History
| Date | Status | Loan Amount | Loan Type |
|---|---|---|---|
| Open | $452,000 | New Conventional | |
| Closed | $333,750 | New Conventional | |
| Closed | $160,692 | New Conventional | |
| Previous Owner | $395,082 | Reverse Mortgage Home Equity Conversion Mortgage |
Source: Public Records
Similar Homes in Layton, UT
Source: UtahRealEstate.com
MLS Number: 2093247
APN: 09-069-0157
Disclaimer: Certain information contained herein is derived from information provided by parties other than Homes.com. All information provided is deemed reliable, but is not guaranteed to be accurate and should be independently verified.
![]() IDX information is provided exclusively for consumers’ personal, non-commercial use, that it may not be used for any purpose other than to identify prospective properties consumers may be interested in purchasing, and that the data is deemed reliable but is not guaranteed accurate by the MLS. Licensor is only providing the MLS Content and not other sources of data provided in the Product.
IDX information is provided exclusively for consumers’ personal, non-commercial use, that it may not be used for any purpose other than to identify prospective properties consumers may be interested in purchasing, and that the data is deemed reliable but is not guaranteed accurate by the MLS. Licensor is only providing the MLS Content and not other sources of data provided in the Product.
Based on information from the Wasatch Front Regional Multiple Listing Service, Inc.. All data, including all measurements and calculations of area, is obtained from various sources and has not been, and will not be, verified by broker or the MLS. All information should be independently reviewed and verified for accuracy. Properties may or may not be listed by the office/agent presenting the information.
Nearby Homes
- 2539 E Oak Ln
- 2316 E Rolling Oaks Ln
- 2719 Oak Ln
- 2522 E 1950 N
- 2141 E Oak Ln Unit 5
- 1920 N 2550 E
- 2588 E 1930 N
- 2782 Brinton Way
- 2435 E 2750 N
- 1884 N 2700 E Unit 302
- 2247 Country Oaks Dr
- 2391 Kays Creek Dr
- 2826 Brinton Cir
- 2718 N 2125 E
- 2411 Kays Creek Dr
- 1847 E 2100 N
- 2242 Deere View Dr
- 1522 N 2200 E
- 2306 E Derus Way
- 1911 Deere Valley Dr
- 1425 E 2400 N
- 1342 Hillsboro Dr Unit Basement
- 3310 N 1750 E
- 1157 E 2450 N
- 2925 N Church St
- 2374 N 1075 E
- 3325 N 2550 E
- 1375 Jaques Dr
- 2997 E S Village Dr
- 3003 E S Village Dr
- 2986 E N Vlg Dr
- 3055 E N Vlg Dr
- 754 Eastside Dr
- 1225 E Gentile St
- 250 N Adamswood Rd
- 2253 N 10 W Unit ID1250604P
- 1039 Gentile St E Unit 1039
- 1482 N 160 W
- 1805 N 225 W
- 2090 N Hillfield Rd