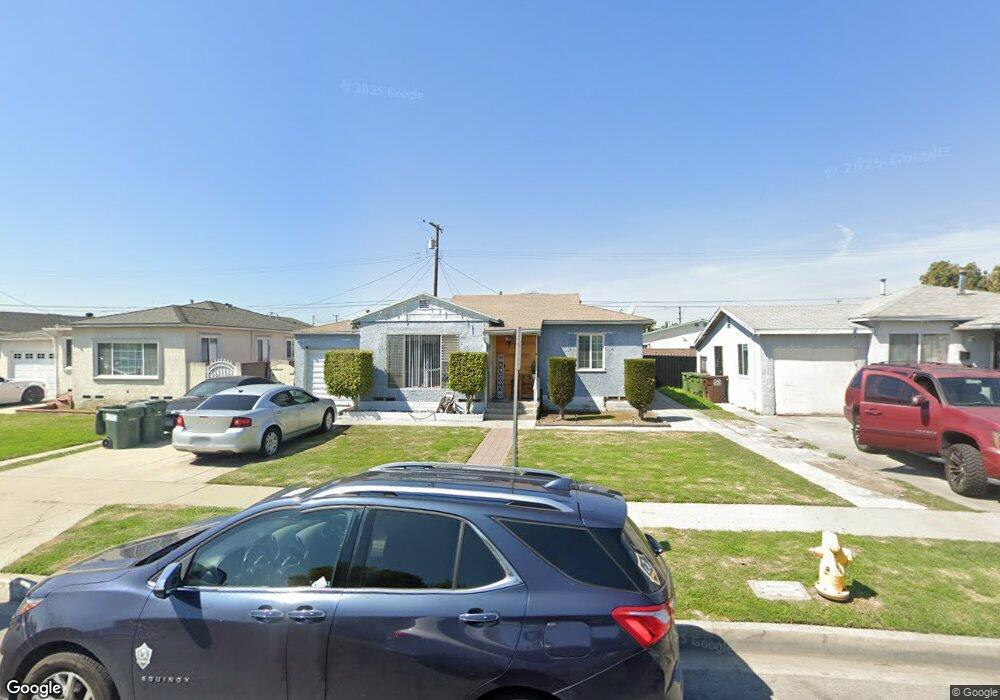
2203 N Grape Ave Compton, CA 90222
Estimated Value: $570,000 - $719,000
3
Beds
2
Baths
1,384
Sq Ft
$456/Sq Ft
Est. Value
About This Home
This home is located at 2203 N Grape Ave, Compton, CA 90222 and is currently estimated at $630,939, approximately $455 per square foot. 2203 N Grape Ave is a home located in Los Angeles County with nearby schools including Anderson Elementary School, Benjamin O. Davis Middle School, and Centennial High School.
Ownership History
Date
Name
Owned For
Owner Type
Purchase Details
Closed on
Sep 2, 2010
Sold by
Balderas Patricia
Bought by
Lemos Joe A
Current Estimated Value
Home Financials for this Owner
Home Financials are based on the most recent Mortgage that was taken out on this home.
Original Mortgage
$222,010
Outstanding Balance
$148,889
Interest Rate
4.75%
Mortgage Type
FHA
Estimated Equity
$482,050
Purchase Details
Closed on
Nov 20, 2000
Sold by
Woods John W
Bought by
Alvarez Patricia and Alvarez Agustin
Home Financials for this Owner
Home Financials are based on the most recent Mortgage that was taken out on this home.
Original Mortgage
$133,896
Interest Rate
7.71%
Mortgage Type
FHA
Purchase Details
Closed on
Oct 9, 1998
Sold by
Daniels Willie Mae
Bought by
Woods John W and Woods Arthur
Create a Home Valuation Report for This Property
The Home Valuation Report is an in-depth analysis detailing your home's value as well as a comparison with similar homes in the area
Home Values in the Area
Average Home Value in this Area
Purchase History
| Date | Buyer | Sale Price | Title Company |
|---|---|---|---|
| Lemos Joe A | $225,000 | California Title Company | |
| Lemos Joe A | -- | California Title Company | |
| Balderas Patricia | -- | California Title Company | |
| Alvarez Agustin | -- | California Title Company | |
| Alvarez Patricia | $135,000 | Southland Title Corporation | |
| Woods John W | -- | -- |
Source: Public Records
Mortgage History
| Date | Status | Borrower | Loan Amount |
|---|---|---|---|
| Open | Lemos Joe A | $222,010 | |
| Previous Owner | Alvarez Patricia | $133,896 |
Source: Public Records
Tax History
| Year | Tax Paid | Tax Assessment Tax Assessment Total Assessment is a certain percentage of the fair market value that is determined by local assessors to be the total taxable value of land and additions on the property. | Land | Improvement |
|---|---|---|---|---|
| 2025 | $5,486 | $288,254 | $112,227 | $176,027 |
| 2024 | $5,486 | $282,603 | $110,027 | $172,576 |
| 2023 | $5,416 | $277,063 | $107,870 | $169,193 |
| 2022 | $5,426 | $271,631 | $105,755 | $165,876 |
| 2021 | $4,838 | $266,306 | $103,682 | $162,624 |
| 2019 | $4,991 | $258,408 | $100,607 | $157,801 |
| 2018 | $4,838 | $253,342 | $98,635 | $154,707 |
| 2016 | $4,581 | $243,505 | $94,805 | $148,700 |
| 2015 | $4,385 | $239,848 | $93,381 | $146,467 |
| 2014 | $4,307 | $235,150 | $91,552 | $143,598 |
Source: Public Records
Map
Nearby Homes
- 2207 N Anzac Ave
- 1808 N Grape Ave
- 850 W 132nd St
- 2102 E Lucien St
- 813 W Stockwell St
- 2107 E Stockwell St
- 924 W 134th Place
- 1608 N Grape Ave
- 2121 E Piru St
- 2062 E Hatchway St
- 720 W 137th St
- 0 W 134th Place
- 1716 N Grandee Ave
- 701 W 139th St
- 2143 E 126th St
- 910 W 138th St
- 1036 W Stockwell St
- 13115 S Largo Ave
- 810 W 133rd St
- 629 W Plum St
- 2131 N Grape Ave
- 2207 N Grape Ave
- 2200 N Anzac Ave
- 2127 N Grape Ave
- 2211 N Grape Ave
- 2128 N Anzac Ave
- 2204 N Anzac Ave
- 2124 N Anzac Ave
- 2208 N Anzac Ave Unit 1
- 2208 N Anzac Ave
- 2123 N Grape Ave
- 2215 N Grape Ave
- 2200 N Grape Ave
- 2128 N Grape Ave
- 2204 N Grape Ave
- 2120 N Anzac Ave
- 2212 N Anzac Ave
- 2124 N Grape Ave
- 2208 N Grape Ave
- 2119 N Grape Ave
Your Personal Tour Guide
Ask me questions while you tour the home.