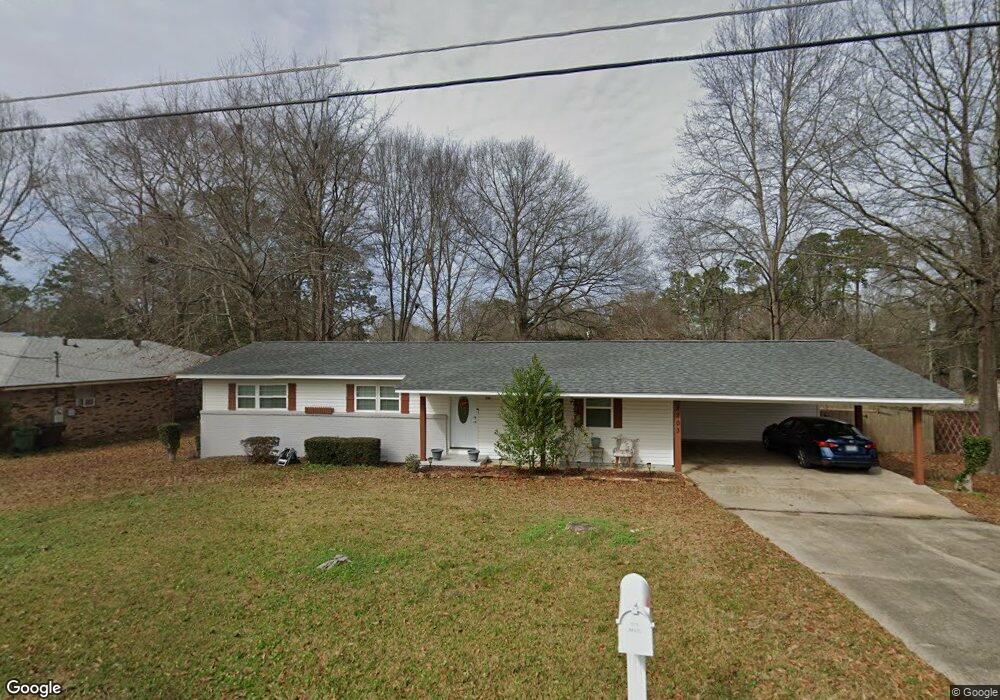
2203 Quinn St Hattiesburg, MS 39401
The Heights-Avenues NeighborhoodEstimated Value: $153,000 - $180,000
--
Bed
--
Bath
1,288
Sq Ft
$129/Sq Ft
Est. Value
About This Home
This home is located at 2203 Quinn St, Hattiesburg, MS 39401 and is currently estimated at $166,461, approximately $129 per square foot. 2203 Quinn St is a home located in Forrest County with nearby schools including Woodley Elementary School, N.R. Burger Middle School, and Hattiesburg High School.
Ownership History
Date
Name
Owned For
Owner Type
Purchase Details
Closed on
Jul 18, 2022
Sold by
Davis Family Ventures Llc
Bought by
Leflore Lamya R
Current Estimated Value
Home Financials for this Owner
Home Financials are based on the most recent Mortgage that was taken out on this home.
Original Mortgage
$159,000
Outstanding Balance
$151,270
Interest Rate
5.09%
Mortgage Type
Balloon
Estimated Equity
$15,191
Purchase Details
Closed on
Aug 5, 2020
Sold by
Stringer Adam L
Bought by
Davis Family Ventures Llc
Create a Home Valuation Report for This Property
The Home Valuation Report is an in-depth analysis detailing your home's value as well as a comparison with similar homes in the area
Home Values in the Area
Average Home Value in this Area
Purchase History
| Date | Buyer | Sale Price | Title Company |
|---|---|---|---|
| Leflore Lamya R | -- | Luckett Land Title | |
| Davis Family Ventures Llc | -- | -- |
Source: Public Records
Mortgage History
| Date | Status | Borrower | Loan Amount |
|---|---|---|---|
| Open | Leflore Lamya R | $159,000 |
Source: Public Records
Tax History Compared to Growth
Tax History
| Year | Tax Paid | Tax Assessment Tax Assessment Total Assessment is a certain percentage of the fair market value that is determined by local assessors to be the total taxable value of land and additions on the property. | Land | Improvement |
|---|---|---|---|---|
| 2024 | $981 | $6,819 | $0 | $0 |
| 2023 | $981 | $68,190 | $0 | $0 |
| 2022 | $1,879 | $10,173 | $0 | $0 |
| 2021 | $1,879 | $10,173 | $0 | $0 |
| 2020 | $1,817 | $9,933 | $0 | $0 |
| 2019 | $1,811 | $9,933 | $0 | $0 |
| 2018 | $1,817 | $9,933 | $0 | $0 |
| 2017 | $1,805 | $9,933 | $0 | $0 |
| 2016 | $1,775 | $9,836 | $0 | $0 |
| 2015 | $1,747 | $9,836 | $0 | $0 |
| 2014 | $1,706 | $9,836 | $0 | $0 |
Source: Public Records
Map
Nearby Homes