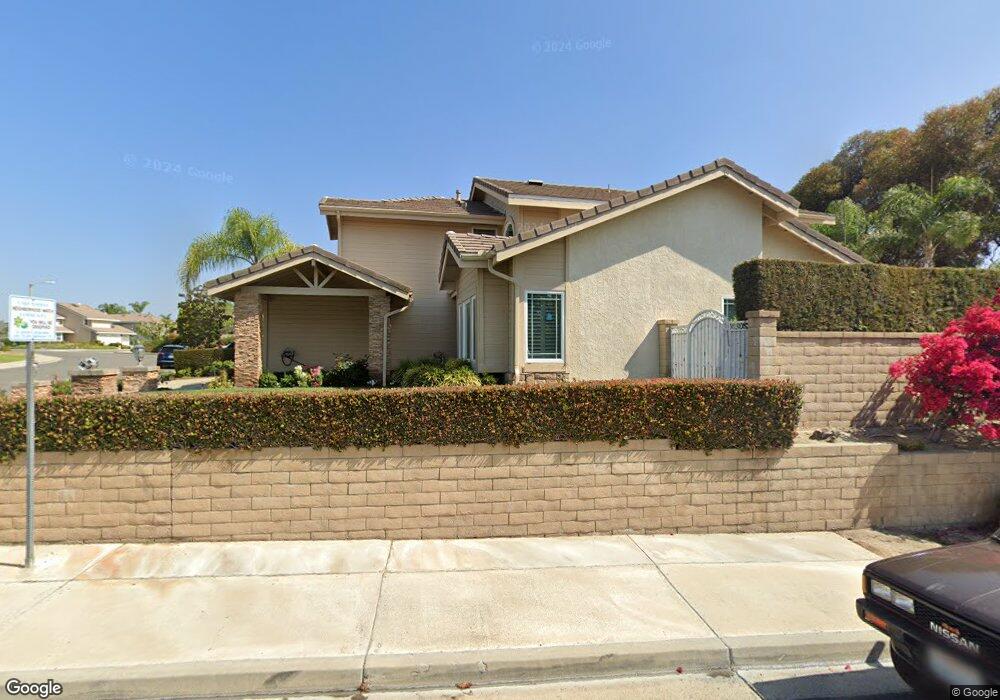
22032 Elsberry Way Lake Forest, CA 92630
Estimated Value: $1,472,000 - $1,640,000
4
Beds
3
Baths
2,596
Sq Ft
$598/Sq Ft
Est. Value
About This Home
This home is located at 22032 Elsberry Way, Lake Forest, CA 92630 and is currently estimated at $1,551,724, approximately $597 per square foot. 22032 Elsberry Way is a home located in Orange County with nearby schools including Lake Forest Elementary School, Serrano Intermediate School, and El Toro High School.
Ownership History
Date
Name
Owned For
Owner Type
Purchase Details
Closed on
Dec 7, 2004
Sold by
Crandall Thomas L
Bought by
Crandall Thomas L and Thomas L Crandall Living Trust
Current Estimated Value
Purchase Details
Closed on
Sep 13, 1999
Sold by
Chetan Desai and Chetan Kavita
Bought by
Crandall Thomas
Home Financials for this Owner
Home Financials are based on the most recent Mortgage that was taken out on this home.
Original Mortgage
$324,800
Outstanding Balance
$93,927
Interest Rate
7.5%
Estimated Equity
$1,457,797
Purchase Details
Closed on
Nov 2, 1993
Sold by
Hergenreder L David and Hergenreder Mickey
Bought by
Desai Chetan and Desai Kavita
Home Financials for this Owner
Home Financials are based on the most recent Mortgage that was taken out on this home.
Original Mortgage
$248,000
Interest Rate
3.37%
Create a Home Valuation Report for This Property
The Home Valuation Report is an in-depth analysis detailing your home's value as well as a comparison with similar homes in the area
Home Values in the Area
Average Home Value in this Area
Purchase History
| Date | Buyer | Sale Price | Title Company |
|---|---|---|---|
| Crandall Thomas L | -- | -- | |
| Crandall Thomas | $406,000 | Fidelity National Title Ins | |
| Desai Chetan | $310,000 | Continental Lawyers Title Co |
Source: Public Records
Mortgage History
| Date | Status | Borrower | Loan Amount |
|---|---|---|---|
| Open | Crandall Thomas | $324,800 | |
| Previous Owner | Desai Chetan | $248,000 | |
| Closed | Crandall Thomas | $40,600 |
Source: Public Records
Tax History Compared to Growth
Tax History
| Year | Tax Paid | Tax Assessment Tax Assessment Total Assessment is a certain percentage of the fair market value that is determined by local assessors to be the total taxable value of land and additions on the property. | Land | Improvement |
|---|---|---|---|---|
| 2025 | $6,411 | $624,006 | $365,460 | $258,546 |
| 2024 | $6,411 | $611,771 | $358,294 | $253,477 |
| 2023 | $6,260 | $599,776 | $351,269 | $248,507 |
| 2022 | $6,148 | $588,016 | $344,381 | $243,635 |
| 2021 | $6,026 | $576,487 | $337,629 | $238,858 |
| 2020 | $5,972 | $570,576 | $334,167 | $236,409 |
| 2019 | $5,853 | $559,389 | $327,615 | $231,774 |
| 2018 | $5,744 | $548,421 | $321,191 | $227,230 |
| 2017 | $5,630 | $537,668 | $314,893 | $222,775 |
| 2016 | $5,537 | $527,126 | $308,719 | $218,407 |
| 2015 | $5,470 | $519,209 | $304,082 | $215,127 |
| 2014 | $5,352 | $509,039 | $298,126 | $210,913 |
Source: Public Records
Map
Nearby Homes
- 26262 Hesby Way
- 25761 Le Parc Unit 82
- 25761 Le Parc Unit 89
- 25712 Le Parc Unit 7
- 25671 Le Parc Unit 85
- 25671 Le Parc Unit 82
- 22201 Center Pointe Unit 2D
- 25885 Trabuco Rd Unit 41
- 25885 Trabuco Rd Unit 91
- 25885 Trabuco Rd Unit 206
- 25885 Trabuco Rd Unit 226
- 25885 Trabuco Rd Unit 33
- 25885 Trabuco Rd Unit 271
- 25885 Trabuco Rd Unit 306
- 25631 Mont Pointe Unit 7D
- 25644 Mont Pointe Unit 1A
- 25614 Mont Pointe Unit 3D
- 25971 Donegal Ln
- 26445 Sandy Creek
- 26421 Pebble Creek
- 22016 Elsberry Way
- 22052 Elsberry Way
- 22002 Elsberry Way
- 22051 Richford Dr
- 22031 Elsberry Way
- 22041 Elsberry Way
- 22066 Elsberry Way
- 22015 Elsberry Way
- 21996 Elsberry Way
- 22051 Elsberry Way
- 22061 Richford Dr
- 22065 Elsberry Way
- 22076 Elsberry Way
- 22001 Elsberry Way
- 21992 Drexel Way
- 22056 Richford Dr
- 22075 Richford Dr
- 22075 Elsberry Way
- 21972 Drexel Way
- 22086 Elsberry Way