2204 Curtis Ave Unit B Redondo Beach, CA 90278
North Redondo Beach NeighborhoodEstimated Value: $1,219,000 - $1,500,000
3
Beds
3
Baths
2,021
Sq Ft
$647/Sq Ft
Est. Value
About This Home
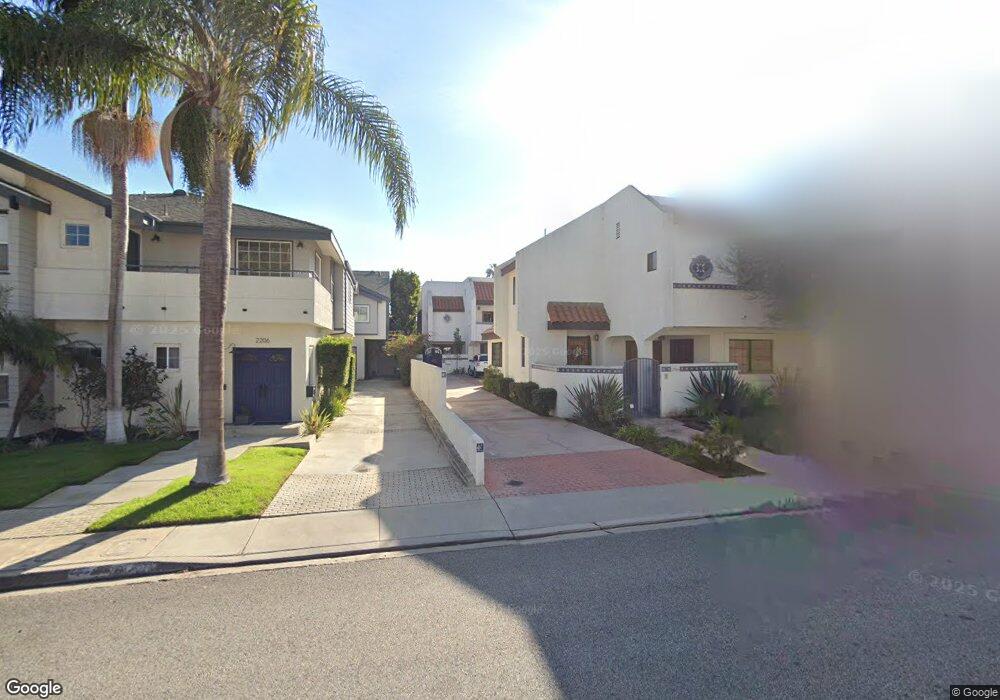
This home is located at 2204 Curtis Ave Unit B, Redondo Beach, CA 90278 and is currently estimated at $1,308,025, approximately $647 per square foot. 2204 Curtis Ave Unit B is a home located in Los Angeles County with nearby schools including Madison Elementary School, Adams Middle School, and Redondo Union High School.
Ownership History
Date
Name
Owned For
Owner Type
Purchase Details
Closed on
Dec 8, 2017
Sold by
Johnson Roy A
Bought by
Johnson Roy A and The Roy A Johnson4urtis Avenue
Current Estimated Value
Home Financials for this Owner
Home Financials are based on the most recent Mortgage that was taken out on this home.
Original Mortgage
$133,500
Outstanding Balance
$74,321
Interest Rate
3.94%
Mortgage Type
New Conventional
Estimated Equity
$1,233,704
Purchase Details
Closed on
Aug 1, 2016
Sold by
Johnson Roy A
Bought by
Johnson Roy A and The Roy A Johnson Curtis Avenu
Purchase Details
Closed on
Aug 4, 1994
Sold by
Klebs Robert W
Bought by
Johnson Roy A
Home Financials for this Owner
Home Financials are based on the most recent Mortgage that was taken out on this home.
Original Mortgage
$218,700
Interest Rate
8.37%
Create a Home Valuation Report for This Property
The Home Valuation Report is an in-depth analysis detailing your home's value as well as a comparison with similar homes in the area
Home Values in the Area
Average Home Value in this Area
Purchase History
| Date | Buyer | Sale Price | Title Company |
|---|---|---|---|
| Johnson Roy A | -- | Accommodation | |
| Johnson Roy A | -- | Wfg National Title | |
| Johnson Roy A | -- | None Available | |
| Johnson Roy A | $243,000 | Title Land Company |
Source: Public Records
Mortgage History
| Date | Status | Borrower | Loan Amount |
|---|---|---|---|
| Open | Johnson Roy A | $133,500 | |
| Closed | Johnson Roy A | $218,700 |
Source: Public Records
Tax History Compared to Growth
Tax History
| Year | Tax Paid | Tax Assessment Tax Assessment Total Assessment is a certain percentage of the fair market value that is determined by local assessors to be the total taxable value of land and additions on the property. | Land | Improvement |
|---|---|---|---|---|
| 2025 | $5,366 | $408,142 | $208,102 | $200,040 |
| 2024 | $5,366 | $400,140 | $204,022 | $196,118 |
| 2023 | $5,278 | $392,295 | $200,022 | $192,273 |
| 2022 | $5,167 | $384,603 | $196,100 | $188,503 |
| 2021 | $5,015 | $377,062 | $192,255 | $184,807 |
| 2019 | $4,880 | $365,880 | $186,553 | $179,327 |
| 2018 | $4,706 | $358,707 | $182,896 | $175,811 |
| 2017 | $4,634 | $351,674 | $179,310 | $172,364 |
| 2016 | $4,541 | $344,780 | $175,795 | $168,985 |
| 2015 | $4,464 | $339,602 | $173,155 | $166,447 |
| 2014 | $4,404 | $332,951 | $169,764 | $163,187 |
Source: Public Records
Map
Nearby Homes
- 2217 Voorhees Ave
- 2212 Gates Ave Unit A
- 2021 Curtis Ave
- 2227 Mathews Ave
- 2022 Mathews Ave
- 2304 Mathews Ave Unit 2
- 2405 Mathews Ave Unit C
- 2405 Mathews Ave Unit B
- 2005 Mathews Ave Unit C
- 2200 Vanderbilt Ln Unit 17
- 1912 Ruhland Ave Unit A
- 2213 Carnegie Ln Unit A
- 2005 Phelan Ln
- 2720 27201/2 Carnegie Ln
- 2016 Farrell Ave Unit B
- 2016 Farrell Ave Unit A
- 207 S Aviation Blvd
- 2100 Carnegie Ln
- 1708 Blossom Ln
- 1769 Gates Ave
- 2204 Curtis Ave Unit A
- 2206 Curtis Ave Unit B
- 2206 Curtis Ave Unit A
- 2202 Curtis Ave Unit B
- 2202 Curtis Ave Unit A
- 2200 Curtis Ave
- 2208 Curtis Ave Unit A
- 2208 Curtis Ave Unit B
- 2406 Rindge Ln
- 2210 Curtis Ave Unit B
- 2210 Curtis Ave Unit A
- 2205 Voorhees Ave Unit A
- 2205 Voorhees Ave
- 2203 Voorhees Ave Unit 2
- 2203 Voorhees Ave Unit 3
- 2203 Voorhees Ave Unit 4
- 2203 Voorhees Ave Unit 1
- 2203 Voorhees Ave Unit O4
- 2203 Curtis Ave
- 2203 Curtis Ave Unit B