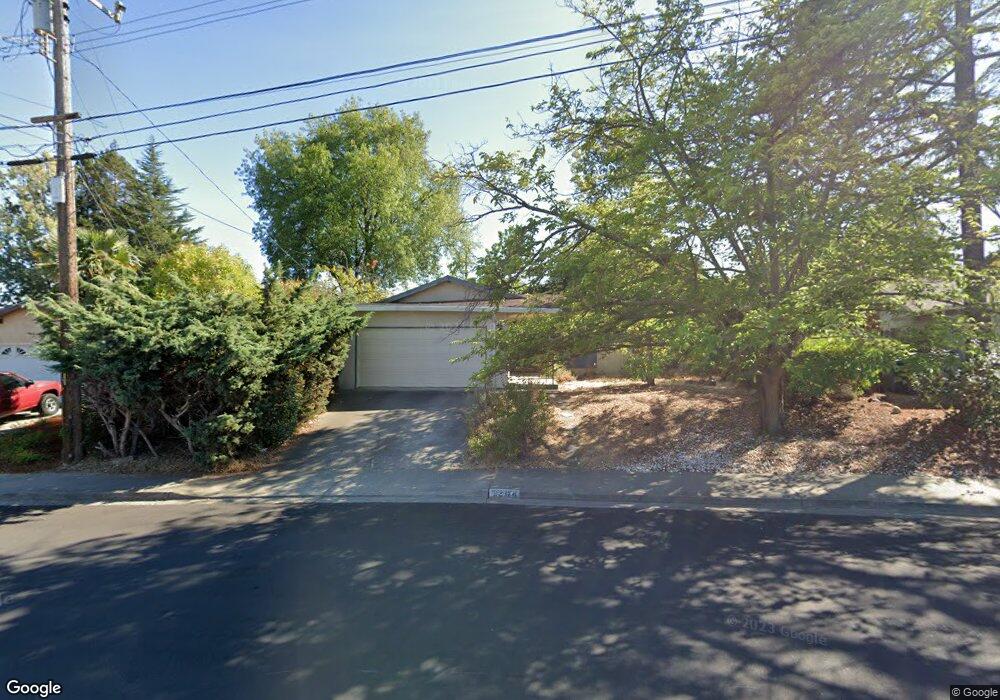
2204 Olympic Dr Martinez, CA 94553
Hidden Valley NeighborhoodEstimated Value: $679,400 - $805,000
3
Beds
2
Baths
1,277
Sq Ft
$583/Sq Ft
Est. Value
About This Home
This home is located at 2204 Olympic Dr, Martinez, CA 94553 and is currently estimated at $744,850, approximately $583 per square foot. 2204 Olympic Dr is a home located in Contra Costa County with nearby schools including Hidden Valley Elementary School, Valley View Middle School, and College Park High School.
Ownership History
Date
Name
Owned For
Owner Type
Purchase Details
Closed on
Jan 15, 2025
Sold by
Nimr Kathleen C and Nimr Christopher
Bought by
Kathleen C Nimr Revocable Trust and Nimr
Current Estimated Value
Purchase Details
Closed on
Nov 4, 2011
Sold by
Nimr Kathleen
Bought by
Nimr Kathleen
Home Financials for this Owner
Home Financials are based on the most recent Mortgage that was taken out on this home.
Original Mortgage
$14,000
Interest Rate
3.87%
Mortgage Type
New Conventional
Purchase Details
Closed on
Mar 14, 1998
Sold by
Nimr Kal M
Bought by
Nimr Kathleen
Purchase Details
Closed on
Mar 31, 1994
Sold by
Nimr Khalid M and Nimr Kathleen
Bought by
Nimr Kathleen and Nimr Khalid
Home Financials for this Owner
Home Financials are based on the most recent Mortgage that was taken out on this home.
Original Mortgage
$40,500
Interest Rate
7.15%
Mortgage Type
Purchase Money Mortgage
Create a Home Valuation Report for This Property
The Home Valuation Report is an in-depth analysis detailing your home's value as well as a comparison with similar homes in the area
Home Values in the Area
Average Home Value in this Area
Purchase History
| Date | Buyer | Sale Price | Title Company |
|---|---|---|---|
| Kathleen C Nimr Revocable Trust | -- | None Listed On Document | |
| Nimr Kathleen | -- | Accommodation | |
| Nimr Kathleen | -- | -- | |
| Nimr Kathleen | -- | Fidelity National Title Ins |
Source: Public Records
Mortgage History
| Date | Status | Borrower | Loan Amount |
|---|---|---|---|
| Previous Owner | Nimr Kathleen | $14,000 | |
| Previous Owner | Nimr Kathleen | $40,500 |
Source: Public Records
Tax History
| Year | Tax Paid | Tax Assessment Tax Assessment Total Assessment is a certain percentage of the fair market value that is determined by local assessors to be the total taxable value of land and additions on the property. | Land | Improvement |
|---|---|---|---|---|
| 2025 | $1,737 | $82,157 | $29,621 | $52,536 |
| 2024 | $1,646 | $80,547 | $29,041 | $51,506 |
| 2023 | $1,646 | $78,969 | $28,472 | $50,497 |
| 2022 | $1,631 | $77,421 | $27,914 | $49,507 |
| 2021 | $1,509 | $75,904 | $27,367 | $48,537 |
| 2019 | $1,427 | $73,655 | $26,556 | $47,099 |
| 2018 | $1,379 | $72,212 | $26,036 | $46,176 |
| 2017 | $1,318 | $70,797 | $25,526 | $45,271 |
| 2016 | $1,329 | $69,410 | $25,026 | $44,384 |
| 2015 | $1,227 | $68,369 | $24,651 | $43,718 |
| 2014 | $1,186 | $67,031 | $24,169 | $42,862 |
Source: Public Records
Map
Nearby Homes
- 2054 Deerwood Dr
- 168 High St
- 1241 Raymond Dr
- 1625 Endriss Dr
- 116 Woodview Ct
- 1602 Endriss Dr
- 319 Oak Glen Ct
- 269 Hidden Creek Ct
- 15 Crosby Ct
- 235 Pebblecreek Ct
- 896 Camelback Place
- 833 Camelback Place
- 0 Pacheco Blvd
- 126 Saint Joan Ln
- 905 Tierney Place
- 1566 Ashwood Dr
- 3 Saint Louis Ln
- 410 Camelback Rd
- 1524 Ridgewood Dr
- 4970 Blum Rd
- 2212 Olympic Dr
- 2131 Shasta Dr
- 2141 Shasta Dr
- 2121 Shasta Dr
- 2220 Olympic Dr
- 2156 Olympic Dr
- 2151 Shasta Dr
- 2153 Olympic Dr
- 2211 Olympic Dr
- 2111 Shasta Dr
- 2221 Olympic Dr
- 2228 Olympic Dr
- 2205 Shasta Dr
- 2140 Olympic Dr
- 2133 Olympic Dr
- 2029 Rainier Dr
- 2105 Shasta Dr
- 2130 Shasta Dr
- 2142 Shasta Dr
- 2229 Olympic Dr
Your Personal Tour Guide
Ask me questions while you tour the home.