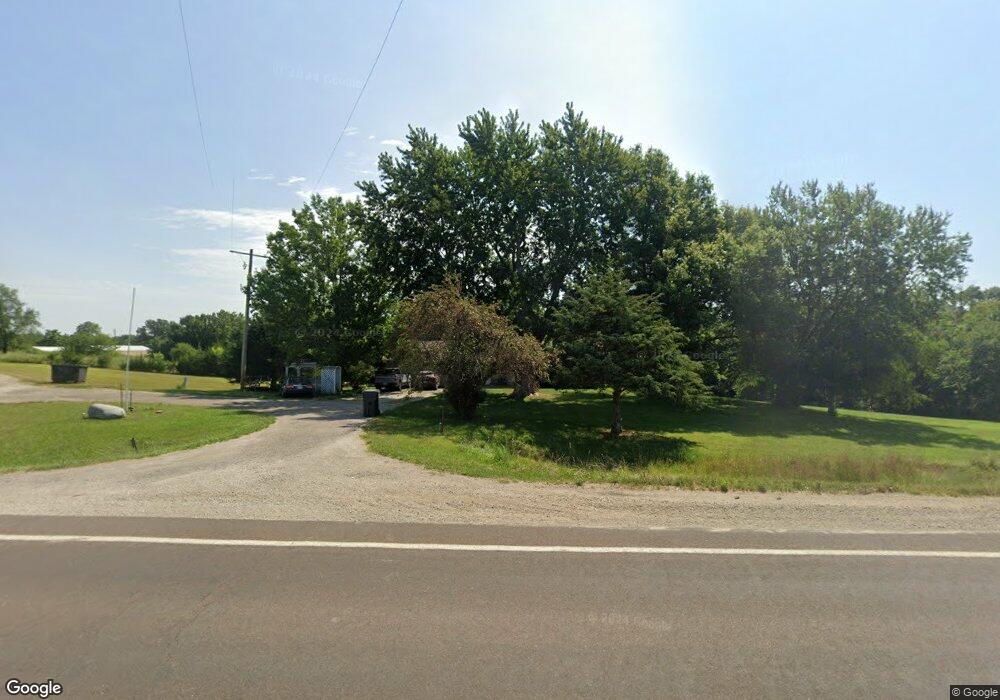
2204 Us Highway 73 Hiawatha, KS 66434
Estimated Value: $202,000 - $383,000
3
Beds
2
Baths
1,350
Sq Ft
$206/Sq Ft
Est. Value
About This Home
This home is located at 2204 Us Highway 73, Hiawatha, KS 66434 and is currently estimated at $277,839, approximately $205 per square foot. 2204 Us Highway 73 is a home located in Brown County with nearby schools including Hiawatha Elementary School, Hiawatha Middle School, and Hiawatha Senior High School.
Ownership History
Date
Name
Owned For
Owner Type
Purchase Details
Closed on
May 16, 2022
Sold by
Jones Jereme E
Bought by
Dankenbring Craig and Dankenbring Pamula K
Current Estimated Value
Home Financials for this Owner
Home Financials are based on the most recent Mortgage that was taken out on this home.
Original Mortgage
$140,000
Outstanding Balance
$116,454
Interest Rate
4.48%
Mortgage Type
New Conventional
Estimated Equity
$161,385
Purchase Details
Closed on
Dec 18, 2011
Sold by
Jones Steven R and Auvil Jones Andrea Michele
Bought by
Jones Jereme E
Home Financials for this Owner
Home Financials are based on the most recent Mortgage that was taken out on this home.
Original Mortgage
$74,000
Interest Rate
4.03%
Mortgage Type
FHA
Purchase Details
Closed on
Jun 29, 2007
Sold by
Sudbeck Rosalee E
Bought by
Armstrong Joseph P and Armstrong Jeri L
Home Financials for this Owner
Home Financials are based on the most recent Mortgage that was taken out on this home.
Original Mortgage
$133,000
Interest Rate
6.41%
Mortgage Type
New Conventional
Create a Home Valuation Report for This Property
The Home Valuation Report is an in-depth analysis detailing your home's value as well as a comparison with similar homes in the area
Home Values in the Area
Average Home Value in this Area
Purchase History
| Date | Buyer | Sale Price | Title Company |
|---|---|---|---|
| Dankenbring Craig | -- | None Listed On Document | |
| Jones Jereme E | -- | None Available | |
| Armstrong Joseph P | -- | None Available |
Source: Public Records
Mortgage History
| Date | Status | Borrower | Loan Amount |
|---|---|---|---|
| Open | Dankenbring Craig | $140,000 | |
| Previous Owner | Jones Jereme E | $74,000 | |
| Previous Owner | Armstrong Joseph P | $133,000 | |
| Previous Owner | Armstrong Joseph P | $133,000 |
Source: Public Records
Tax History Compared to Growth
Tax History
| Year | Tax Paid | Tax Assessment Tax Assessment Total Assessment is a certain percentage of the fair market value that is determined by local assessors to be the total taxable value of land and additions on the property. | Land | Improvement |
|---|---|---|---|---|
| 2025 | $2,157 | $25,948 | $3,278 | $22,670 |
| 2024 | $2,157 | $22,844 | $2,191 | $20,653 |
| 2023 | $1,984 | $20,569 | $1,708 | $18,861 |
| 2022 | $1,692 | $17,928 | $1,530 | $16,398 |
| 2021 | $1,460 | $14,901 | $1,530 | $13,371 |
| 2020 | $1,284 | $13,427 | $1,530 | $11,897 |
| 2019 | $1,247 | $12,787 | $1,530 | $11,257 |
| 2018 | $1,634 | $15,480 | $1,530 | $13,950 |
| 2017 | $1,634 | $15,836 | $1,127 | $14,709 |
| 2016 | $1,789 | $17,546 | $1,127 | $16,419 |
| 2015 | -- | $15,962 | $1,127 | $14,835 |
| 2014 | -- | $15,962 | $875 | $15,087 |
Source: Public Records
Map
Nearby Homes
- 2222 Us Highway 73
- 2184 Us Highway 73
- 2199 Us Highway 73
- 2221 Us Highway 73
- 2184 Lake Drive Rd
- 2180 Lake Drive Rd
- 2171 Us Highway 73
- 2173 Us Highway 73
- 2240 Us Highway 73
- 2242 Us Highway 73
- 2246 Us Highway 73
- 1458 220th St
- 2247 Us Highway 73
- 2250 Us Highway 73
- 2220 Linden Rd
- 1454 220th St
- 2254 Us Highway 73
- 2210 Linden Rd
- 2204 Linden Rd
- 2206 Linden Rd