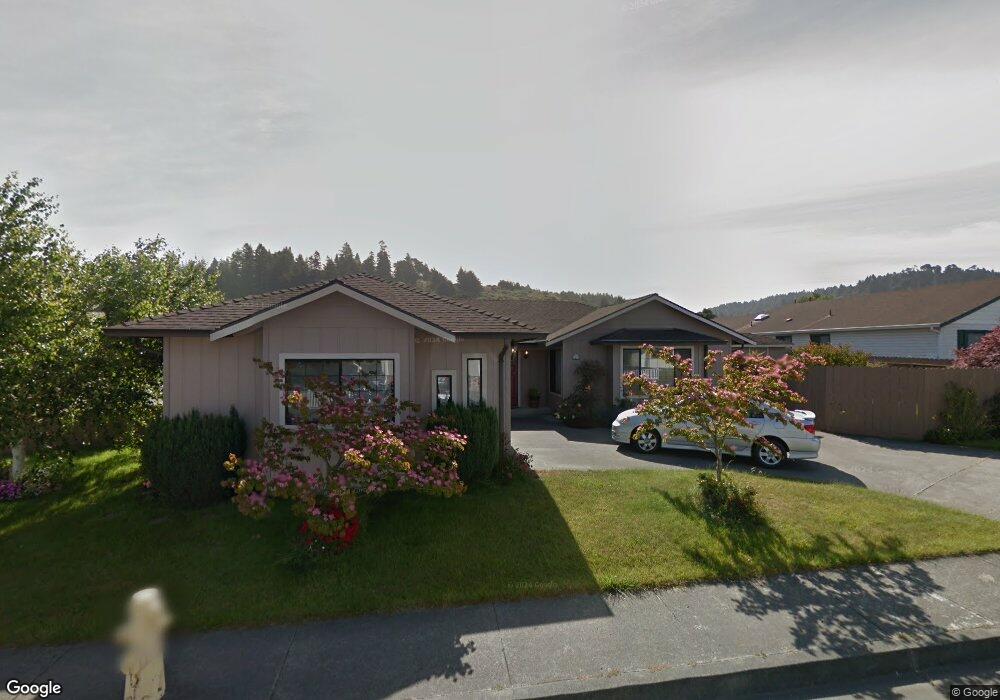
2205 Lee Ct Fortuna, CA 95540
Estimated Value: $407,000 - $525,000
3
Beds
2
Baths
1,588
Sq Ft
$282/Sq Ft
Est. Value
About This Home
This home is located at 2205 Lee Ct, Fortuna, CA 95540 and is currently estimated at $447,887, approximately $282 per square foot. 2205 Lee Ct is a home located in Humboldt County with nearby schools including Fortuna Union High School, East High School, and Redwood Preparatory Charter School.
Ownership History
Date
Name
Owned For
Owner Type
Purchase Details
Closed on
Jun 9, 2021
Sold by
Bixler Mary E and The Mary E Bixter Revocable Tr
Bought by
Dibene Elisabet and Peters Barbara
Current Estimated Value
Purchase Details
Closed on
Mar 25, 2010
Sold by
Millenheft Michael J and Millenheft Judith E
Bought by
Bixler Mary E and Mary E Bixler Revocable Trust
Purchase Details
Closed on
Jun 30, 2006
Sold by
Millenheft Michael J and Millenheft Judith E
Bought by
Millenheft Michael J and Millenheft Judith E
Purchase Details
Closed on
Aug 21, 2002
Sold by
State James W and State Laurine R
Bought by
Millenheft Michael J and Millenheft Judy E
Home Financials for this Owner
Home Financials are based on the most recent Mortgage that was taken out on this home.
Original Mortgage
$197,760
Interest Rate
6.37%
Mortgage Type
VA
Create a Home Valuation Report for This Property
The Home Valuation Report is an in-depth analysis detailing your home's value as well as a comparison with similar homes in the area
Home Values in the Area
Average Home Value in this Area
Purchase History
| Date | Buyer | Sale Price | Title Company |
|---|---|---|---|
| Dibene Elisabet | $315,500 | None Available | |
| Bixler Mary E | $267,000 | Fidelity Natl Title Co Of Ca | |
| Millenheft Michael J | -- | None Available | |
| Millenheft Michael J | $192,000 | Humboldt Land Title Company |
Source: Public Records
Mortgage History
| Date | Status | Borrower | Loan Amount |
|---|---|---|---|
| Previous Owner | Millenheft Michael J | $197,760 |
Source: Public Records
Tax History Compared to Growth
Tax History
| Year | Tax Paid | Tax Assessment Tax Assessment Total Assessment is a certain percentage of the fair market value that is determined by local assessors to be the total taxable value of land and additions on the property. | Land | Improvement |
|---|---|---|---|---|
| 2025 | $4,133 | $392,646 | $132,651 | $259,995 |
| 2024 | $4,133 | $384,948 | $130,050 | $254,898 |
| 2023 | $4,054 | $377,400 | $127,500 | $249,900 |
| 2022 | $4,042 | $370,000 | $125,000 | $245,000 |
| 2021 | $3,504 | $318,394 | $101,360 | $217,034 |
| 2020 | $3,501 | $315,130 | $100,321 | $214,809 |
| 2019 | $3,436 | $308,952 | $98,354 | $210,598 |
| 2018 | $3,392 | $302,895 | $96,426 | $206,469 |
| 2017 | $3,232 | $296,957 | $94,536 | $202,421 |
| 2016 | $3,152 | $291,135 | $92,683 | $198,452 |
| 2015 | $3,049 | $286,763 | $91,291 | $195,472 |
| 2014 | $2,970 | $281,146 | $89,503 | $191,643 |
Source: Public Records
Map
Nearby Homes
- 3310 School St
- 3251 Matthew Ln
- 4372 Forest Hills Dr
- 1545 Xavier Ct
- 4391 Woodcock Ct
- 2550 W School St
- 2755 Highland Dr
- 1757 Cecil Ave
- 1274 Ross Hill Rd
- 1745 Thelma St
- 2725 Murray Ct
- 1545 Kings Row
- 1604 Imperial Way
- 2208 Royal Dr
- 184 Empire Dr
- 197 Empire Dr
- 1521 Imperial Way
- 185 Empire Dr
- 136 Castle Ct
- 160 Monarch Dr