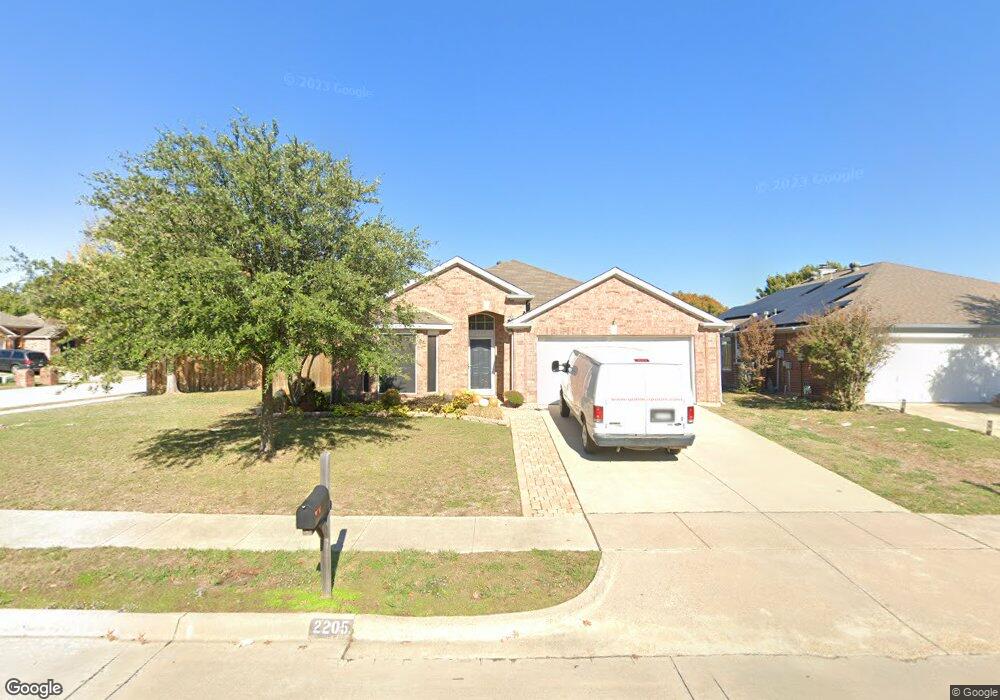
2205 Loon Lake Rd Denton, TX 76210
South Denton NeighborhoodEstimated Value: $359,000 - $379,818
3
Beds
2
Baths
1,866
Sq Ft
$200/Sq Ft
Est. Value
About This Home
This home is located at 2205 Loon Lake Rd, Denton, TX 76210 and is currently estimated at $373,205, approximately $200 per square foot. 2205 Loon Lake Rd is a home located in Denton County with nearby schools including Houston Elementary School, McMath Middle School, and Denton High School.
Ownership History
Date
Name
Owned For
Owner Type
Purchase Details
Closed on
May 18, 2016
Sold by
Ray Bobby L and Ray Laura L
Bought by
Kessler Gregg Thomas
Current Estimated Value
Home Financials for this Owner
Home Financials are based on the most recent Mortgage that was taken out on this home.
Original Mortgage
$206,150
Outstanding Balance
$163,734
Interest Rate
3.59%
Mortgage Type
New Conventional
Estimated Equity
$209,471
Purchase Details
Closed on
Jul 20, 2001
Sold by
Farlow Thomas Michael
Bought by
Ray Bobby L and Ray Laura L
Home Financials for this Owner
Home Financials are based on the most recent Mortgage that was taken out on this home.
Original Mortgage
$109,600
Interest Rate
7.07%
Purchase Details
Closed on
Jan 7, 1999
Sold by
Pulte Homes Of Texas Lp
Bought by
Farlow Thomas Michael
Home Financials for this Owner
Home Financials are based on the most recent Mortgage that was taken out on this home.
Original Mortgage
$121,821
Interest Rate
6.74%
Mortgage Type
FHA
Create a Home Valuation Report for This Property
The Home Valuation Report is an in-depth analysis detailing your home's value as well as a comparison with similar homes in the area
Home Values in the Area
Average Home Value in this Area
Purchase History
| Date | Buyer | Sale Price | Title Company |
|---|---|---|---|
| Kessler Gregg Thomas | -- | Title Resources | |
| Ray Bobby L | -- | -- | |
| Farlow Thomas Michael | -- | -- |
Source: Public Records
Mortgage History
| Date | Status | Borrower | Loan Amount |
|---|---|---|---|
| Open | Kessler Gregg Thomas | $206,150 | |
| Previous Owner | Ray Bobby L | $109,600 | |
| Previous Owner | Farlow Thomas Michael | $121,821 | |
| Closed | Ray Bobby L | $20,550 |
Source: Public Records
Tax History Compared to Growth
Tax History
| Year | Tax Paid | Tax Assessment Tax Assessment Total Assessment is a certain percentage of the fair market value that is determined by local assessors to be the total taxable value of land and additions on the property. | Land | Improvement |
|---|---|---|---|---|
| 2025 | $5,433 | $340,000 | $75,003 | $264,997 |
| 2024 | $6,628 | $343,398 | $0 | $0 |
| 2023 | $4,764 | $312,180 | $71,169 | $275,831 |
| 2022 | $6,025 | $283,800 | $75,003 | $241,320 |
| 2021 | $5,329 | $239,704 | $52,828 | $186,876 |
| 2020 | $5,554 | $243,000 | $58,698 | $184,302 |
| 2019 | $5,750 | $241,000 | $58,698 | $182,302 |
| 2018 | $5,527 | $228,800 | $58,698 | $181,638 |
| 2017 | $5,141 | $208,000 | $58,698 | $149,302 |
| 2016 | $4,846 | $196,055 | $39,132 | $161,061 |
| 2015 | $3,986 | $178,232 | $39,132 | $139,100 |
| 2014 | $3,986 | $169,932 | $39,132 | $130,800 |
| 2013 | -- | $159,357 | $39,132 | $120,225 |
Source: Public Records
Map
Nearby Homes
- 2209 Loon Lake Rd
- 2312 Caddo Cir
- 2000 Lamprey Cir
- 2409 Loon Lake Rd
- 2009 Lake Fork Ct
- 2505 Pioneer Dr
- 3432 Sundown Blvd
- 2508 Pioneer Dr
- 2600 Pioneer Dr
- 2501 Great Bear Ln
- 2601 Pinto Dr
- 720 Smokerise Cir
- 2713 Clubhouse Dr
- 1108 Ellison Park Cir
- 2544 Natchez Trace
- 2617 Hereford Rd
- 2721 Arabian Ave
- 916 Smokerise Cir
- 2272 Hollyhill Ln
- 1012 Indian Ridge Dr
- 3221 Saint Claire Dr
- 2213 Loon Lake Rd
- 3224 Saint Claire Dr
- 3220 Saint Claire Dr
- 2204 Loon Lake Rd
- 3217 Saint Claire Dr
- 2200 Loon Lake Rd
- 2208 Loon Lake Rd
- 2217 Loon Lake Rd
- 3216 Saint Claire Dr
- 2116 Loon Lake Rd
- 2212 Loon Lake Rd
- 3213 Saint Claire Dr
- 2112 Loon Lake Rd
- 2105 Loon Lake Rd
- 2221 Loon Lake Rd
- 3212 Saint Claire Dr
- 2216 Loon Lake Rd
- 2108 Loon Lake Rd
- 3209 Saint Claire Dr