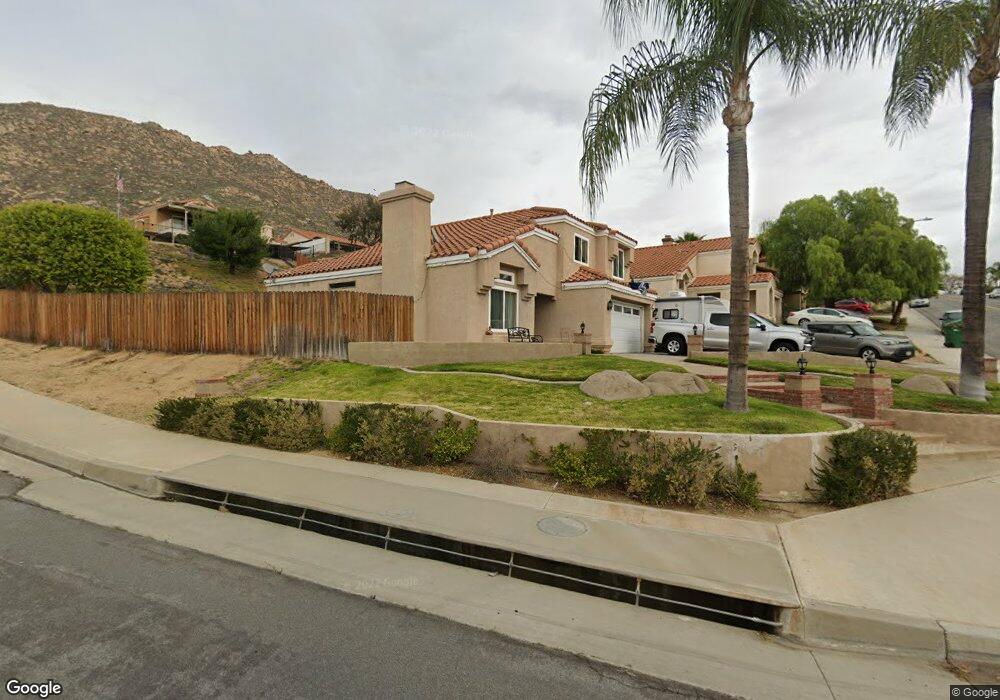
22050 Spring Crest Rd Moreno Valley, CA 92557
North Moreno Valley NeighborhoodEstimated Value: $561,000 - $569,224
4
Beds
3
Baths
1,561
Sq Ft
$361/Sq Ft
Est. Value
About This Home
This home is located at 22050 Spring Crest Rd, Moreno Valley, CA 92557 and is currently estimated at $564,056, approximately $361 per square foot. 22050 Spring Crest Rd is a home located in Riverside County with nearby schools including Box Springs Elementary School, Vista Heights Middle School, and Canyon Springs High School.
Ownership History
Date
Name
Owned For
Owner Type
Purchase Details
Closed on
Sep 5, 2001
Sold by
Brown Anthony T and Brown Gabriella
Bought by
Soto John P and Soto Taryn G
Current Estimated Value
Purchase Details
Closed on
Aug 7, 1999
Sold by
Salcedo Maria C
Bought by
Brown Athony T and Brown Gabriella
Home Financials for this Owner
Home Financials are based on the most recent Mortgage that was taken out on this home.
Original Mortgage
$15,998
Interest Rate
7.7%
Purchase Details
Closed on
Apr 14, 1998
Sold by
Forman Shirley
Bought by
Brown Anthony T and Brown Gabriella
Home Financials for this Owner
Home Financials are based on the most recent Mortgage that was taken out on this home.
Original Mortgage
$117,035
Interest Rate
7.06%
Mortgage Type
FHA
Purchase Details
Closed on
Jun 22, 1994
Sold by
Forman Shirley
Bought by
Forman Shirley
Create a Home Valuation Report for This Property
The Home Valuation Report is an in-depth analysis detailing your home's value as well as a comparison with similar homes in the area
Home Values in the Area
Average Home Value in this Area
Purchase History
| Date | Buyer | Sale Price | Title Company |
|---|---|---|---|
| Soto John P | $157,000 | First American Title Co | |
| Brown Athony T | -- | Fidelity National Title Co | |
| Brown Anthony T | $118,000 | First American Title Ins Co | |
| Forman Shirley | -- | -- |
Source: Public Records
Mortgage History
| Date | Status | Borrower | Loan Amount |
|---|---|---|---|
| Previous Owner | Brown Athony T | $15,998 | |
| Previous Owner | Brown Anthony T | $117,035 |
Source: Public Records
Tax History
| Year | Tax Paid | Tax Assessment Tax Assessment Total Assessment is a certain percentage of the fair market value that is determined by local assessors to be the total taxable value of land and additions on the property. | Land | Improvement |
|---|---|---|---|---|
| 2025 | $2,756 | $231,907 | $59,077 | $172,830 |
| 2023 | $2,756 | $222,904 | $56,784 | $166,120 |
| 2022 | $2,655 | $218,534 | $55,671 | $162,863 |
| 2021 | $2,599 | $214,250 | $54,580 | $159,670 |
| 2020 | $2,567 | $212,054 | $54,021 | $158,033 |
| 2019 | $2,526 | $207,897 | $52,962 | $154,935 |
| 2018 | $2,440 | $203,822 | $51,924 | $151,898 |
| 2017 | $2,415 | $199,826 | $50,906 | $148,920 |
| 2016 | $2,390 | $195,908 | $49,908 | $146,000 |
| 2015 | $2,357 | $192,967 | $49,159 | $143,808 |
| 2014 | $2,203 | $189,189 | $48,197 | $140,992 |
Source: Public Records
Map
Nearby Homes
- 11742 Black Hawk Ln
- 21665 Box Springs Rd
- 22532 Naranja St
- 21540 Calle Monaco
- 21479 Douglasis Ct
- 22722 Wild Geranium Ln
- 21396 Lilium Ct
- 22742 Glendon Dr
- 21440 Shakespeare Ct
- 21401 Greyson Rd
- 11711 Blue Lupin Ln
- 11735 Country Flower Ln
- 21250 Tennyson Rd
- 11425 Tiffany Ln
- 21183 Gallant Fox Dr
- 22600 Echo Lake Rd
- 21095 Martynia Ct
- 22500 Greenwich Ct
- 22350 Yorke Rd Unit 18
- 11830 Carlisle Ct
- 22062 Spring Crest Rd
- 22074 Spring Crest Rd
- 22049 Spring Crest Rd
- 22061 Spring Crest Rd
- 11895 Constantine Cir
- 22037 Spring Crest Rd
- 22073 Spring Crest Rd
- 22086 Spring Crest Rd
- 11875 Constantine Cir
- 22053 Naples Dr
- 22063 Naples Dr
- 11920 Day St
- 22085 Spring Crest Rd
- 11855 Constantine Cir
- 22098 Spring Crest Rd
- 22060 Monico Dr
- 22048 Monico Dr
- 22097 Spring Crest Rd
- 11930 Day St
- 22036 Monico Dr
Your Personal Tour Guide
Ask me questions while you tour the home.