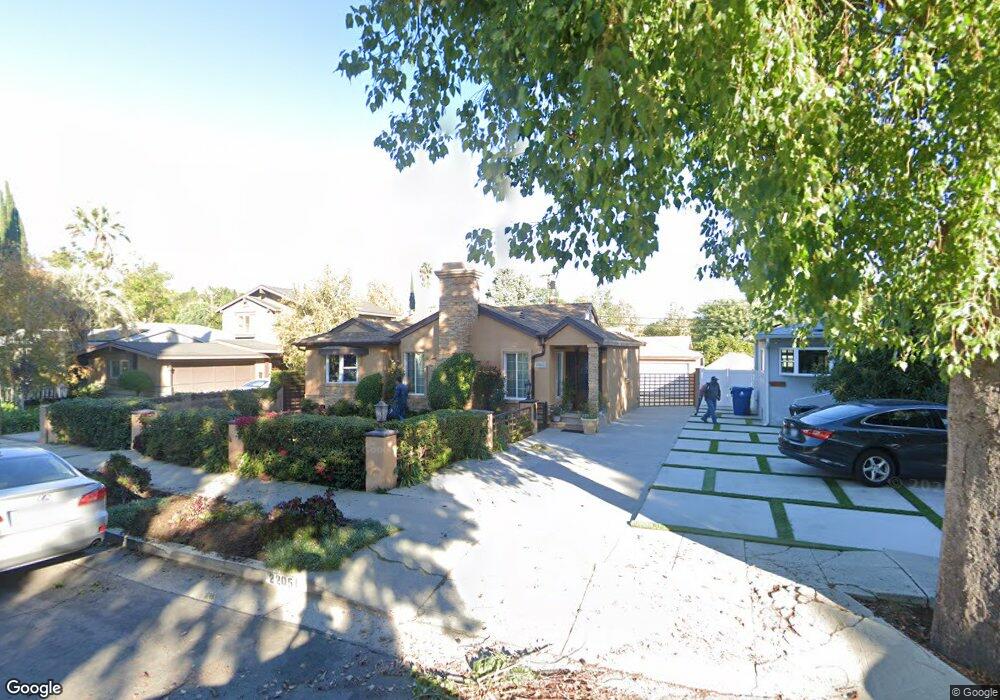
22051 Buena Ventura St Woodland Hills, CA 91364
Estimated Value: $960,000 - $1,143,000
4
Beds
2
Baths
1,541
Sq Ft
$674/Sq Ft
Est. Value
About This Home
This home is located at 22051 Buena Ventura St, Woodland Hills, CA 91364 and is currently estimated at $1,038,157, approximately $673 per square foot. 22051 Buena Ventura St is a home located in Los Angeles County with nearby schools including Woodland Hills Academy, Woodland Hills Elementary Charter For Enriched Studies, and Serrania Charter For Enriched Studies.
Ownership History
Date
Name
Owned For
Owner Type
Purchase Details
Closed on
Aug 7, 2013
Sold by
Nejad Mehrdad Bidokhti
Bought by
Nejad Mehrdad Bidokhti
Current Estimated Value
Home Financials for this Owner
Home Financials are based on the most recent Mortgage that was taken out on this home.
Original Mortgage
$400,000
Outstanding Balance
$297,109
Interest Rate
4.36%
Mortgage Type
New Conventional
Estimated Equity
$741,048
Purchase Details
Closed on
Nov 10, 1995
Sold by
Falk Ernest F C and Falk Joyce E
Bought by
Nezhad Merhdad Bidokhti
Home Financials for this Owner
Home Financials are based on the most recent Mortgage that was taken out on this home.
Original Mortgage
$152,950
Interest Rate
7.48%
Create a Home Valuation Report for This Property
The Home Valuation Report is an in-depth analysis detailing your home's value as well as a comparison with similar homes in the area
Home Values in the Area
Average Home Value in this Area
Purchase History
| Date | Buyer | Sale Price | Title Company |
|---|---|---|---|
| Nejad Mehrdad Bidokhti | -- | Fidelity Van Nuys | |
| Nezhad Merhdad Bidokhti | $161,000 | First American Title Co |
Source: Public Records
Mortgage History
| Date | Status | Borrower | Loan Amount |
|---|---|---|---|
| Open | Nejad Mehrdad Bidokhti | $400,000 | |
| Closed | Nezhad Merhdad Bidokhti | $152,950 |
Source: Public Records
Tax History Compared to Growth
Tax History
| Year | Tax Paid | Tax Assessment Tax Assessment Total Assessment is a certain percentage of the fair market value that is determined by local assessors to be the total taxable value of land and additions on the property. | Land | Improvement |
|---|---|---|---|---|
| 2025 | $4,511 | $354,749 | $206,648 | $148,101 |
| 2024 | $4,511 | $347,795 | $202,597 | $145,198 |
| 2023 | $4,428 | $340,976 | $198,625 | $142,351 |
| 2022 | $4,248 | $334,291 | $194,731 | $139,560 |
| 2021 | $4,192 | $327,737 | $190,913 | $136,824 |
| 2019 | $4,071 | $318,018 | $185,251 | $132,767 |
| 2018 | $3,978 | $311,783 | $181,619 | $130,164 |
| 2016 | $3,778 | $299,677 | $174,567 | $125,110 |
| 2015 | $3,725 | $295,176 | $171,945 | $123,231 |
| 2014 | $3,745 | $289,395 | $168,577 | $120,818 |
Source: Public Records
Map
Nearby Homes
- 22037 Ybarra Rd
- 22002 Ybarra Rd
- 22015 Independencia St
- 4841 Don Pio Dr
- 22051 San Miguel St
- 22051 Mulholland Way
- 4731 Topanga Canyon Blvd
- 22263 Flanco Rd
- 22261 Ybarra Rd
- 22218 San Miguel St
- 4944 Don Pio Dr
- 4616 Coyle Place
- 22025 De la Osa St
- 4642 Santa Lucia Dr
- 22297 Buena Ventura St
- 21907 De la Osa St
- 4976 Llano Dr
- 4610 Cerrillos Dr
- 21914 Velicata St
- 4996 Llano Dr
- 22047 Buena Ventura St
- 22057 Buena Ventura St
- 22041 Buena Ventura St
- 22101 Buena Ventura St
- 22101 Buenaventura St
- 22050 Viscanio Rd
- 22046 Viscanio Rd
- 22056 Viscanio Rd
- 22037 Buena Ventura St
- 22107 Buena Ventura St
- 22040 Viscanio Rd
- 22100 Viscanio Rd
- 22038 Viscanio Rd
- 22050 Buena Ventura St
- 22056 Buenaventura St
- 22056 Buena Ventura St
- 22034 Viscanio Rd
- 22104 Viscanio Rd
- 22031 Buena Ventura St
- 22113 Buena Ventura St