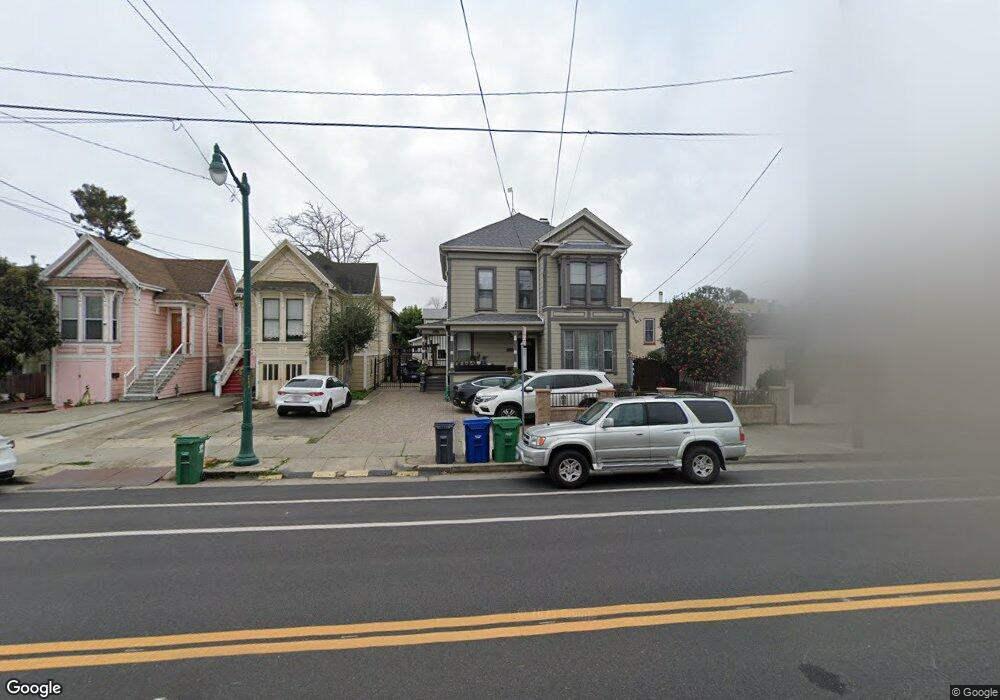
2206 Encinal Ave Alameda, CA 94501
South Shore NeighborhoodEstimated Value: $1,276,000 - $1,646,000
6
Beds
5
Baths
3,573
Sq Ft
$400/Sq Ft
Est. Value
About This Home
This home is located at 2206 Encinal Ave, Alameda, CA 94501 and is currently estimated at $1,430,000, approximately $400 per square foot. 2206 Encinal Ave is a home located in Alameda County with nearby schools including Love Elementary, Will C. Wood Middle School, and Alameda High School.
Ownership History
Date
Name
Owned For
Owner Type
Purchase Details
Closed on
Nov 11, 2013
Sold by
Ho Yao Tang and Mo Shao Xian
Bought by
Ho Yao Tang and Mo Shao Xian
Current Estimated Value
Purchase Details
Closed on
Mar 7, 2013
Sold by
Wong Men Guang and Yin Runmei
Bought by
Ho Yao Tang and Mo Shao Xian
Home Financials for this Owner
Home Financials are based on the most recent Mortgage that was taken out on this home.
Original Mortgage
$520,000
Outstanding Balance
$366,118
Interest Rate
3.49%
Mortgage Type
Seller Take Back
Estimated Equity
$1,063,882
Purchase Details
Closed on
Apr 2, 1996
Sold by
Theron Properties
Bought by
Wong Men Guang and Yin Runmei
Home Financials for this Owner
Home Financials are based on the most recent Mortgage that was taken out on this home.
Original Mortgage
$117,600
Interest Rate
7.34%
Purchase Details
Closed on
Dec 21, 1995
Sold by
Tays Nancy H and Adolfson Family Trust
Bought by
Theron Properties
Purchase Details
Closed on
Aug 28, 1995
Sold by
Adolfson Frances R
Bought by
Tays Nancy H
Create a Home Valuation Report for This Property
The Home Valuation Report is an in-depth analysis detailing your home's value as well as a comparison with similar homes in the area
Home Values in the Area
Average Home Value in this Area
Purchase History
| Date | Buyer | Sale Price | Title Company |
|---|---|---|---|
| Ho Yao Tang | -- | Chicago Title Company | |
| Ho Yao Tang | $560,000 | Chicago Title Company | |
| Wong Men Guang | $168,000 | First American Title Guarant | |
| Theron Properties | $76,000 | -- | |
| Tays Nancy H | -- | -- |
Source: Public Records
Mortgage History
| Date | Status | Borrower | Loan Amount |
|---|---|---|---|
| Open | Ho Yao Tang | $520,000 | |
| Previous Owner | Wong Men Guang | $117,600 |
Source: Public Records
Tax History
| Year | Tax Paid | Tax Assessment Tax Assessment Total Assessment is a certain percentage of the fair market value that is determined by local assessors to be the total taxable value of land and additions on the property. | Land | Improvement |
|---|---|---|---|---|
| 2025 | $14,965 | $944,752 | $206,871 | $744,881 |
| 2024 | $14,965 | $926,094 | $202,816 | $730,278 |
| 2023 | $14,428 | $914,798 | $198,839 | $715,959 |
| 2022 | $11,771 | $750,307 | $194,942 | $562,365 |
| 2021 | $10,265 | $630,067 | $191,120 | $445,947 |
| 2020 | $10,140 | $630,537 | $189,161 | $441,376 |
| 2019 | $9,381 | $618,177 | $185,453 | $432,724 |
| 2018 | $9,151 | $606,060 | $181,818 | $424,242 |
| 2017 | $8,754 | $594,176 | $178,253 | $415,923 |
| 2016 | $8,751 | $582,528 | $174,758 | $407,770 |
| 2015 | $8,714 | $573,781 | $172,134 | $401,647 |
| 2014 | $8,380 | $562,541 | $168,762 | $393,779 |
Source: Public Records
Map
Nearby Homes
- 2118 Alameda Ave
- 2312 San Antonio Ave
- 1251 Park St
- 1241 Park Ave
- 2050 Central Ave
- 2417 Marti Rae Ct
- 976 Park St
- 2137 Otis Dr Unit 111
- 954 Park St
- 2136 Pacific Ave
- 2031 Otis Dr Unit H
- 2106 Otis Dr Unit A
- 2000 Clinton Ave
- 1100 Park Ave
- 2515 Central Ave Unit 203
- 2608 Central Ave
- 1822 Clinton Ave
- 1601 Broadway Unit 9
- 2101 Shoreline Dr Unit 153
- 2101 Shoreline Dr Unit 475
- 2208 Encinal Ave
- 1114 Walnut St
- 2200 Encinal Ave
- 2210 Encinal Ave
- 2212 Encinal Ave
- 1100 Walnut St
- 2205 San Antonio Ave Unit G
- 2205 San Antonio Ave Unit F
- 2205 San Antonio Ave Unit E
- 2205 San Antonio Ave Unit D
- 2205 San Antonio Ave Unit C
- 2205 San Antonio Ave Unit B
- 2205 San Antonio Ave Unit A
- 2216 Encinal Ave
- 2211 San Antonio Ave
- 2219 San Antonio Ave
- 2203 San Antonio Ave
- 1111 Walnut St
- 2164 Encinal Ave
- 2171 San Antonio Ave
Your Personal Tour Guide
Ask me questions while you tour the home.